Property Pulse: Correction nearing end, but upturn might disappoint
24 Mar 2023
- We retain our view of a 20% peak-to-trough correction in house prices, implying a further 4-5% fall from here
- Risks to this view tilt to the downside. We also think any house price recovery later this year will be tepid.
- Mortgage borrowers are tending towards shorter fixing terms, as mortgage rates near peak
Welcome to our inaugural Property Pulse. Supporting our more regular EcoPulse updates, the idea here is to take a more detailed look at all things housing. We also check out mortgage rate dynamics.
The view, in brief
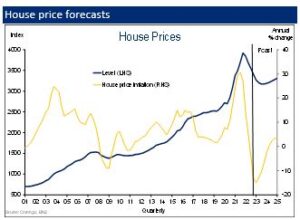
Average house prices in New Zealand have fallen about 16% from the peak in November 2021. BNZ’s long-held view is that the peak-to-trough decline would amount to around 20%. On this basis, house prices have another 4-5% to fall. These sorts of point estimates should be read as a rough guide only, but our broader view is one where the correction is nearing its end and we may see signs of stabilisation emerge over coming months.
Forecasting house prices remains a risky business. Our assessment of the risks around our view is skewed to the downside. This owes to still-stretched house price affordability/valuation metrics and the likelihood of a labour market wobble this year. Recent weather-related devastation also muddies the waters. But, assuming we do see house prices level out around mid-year, attention will quickly shift to the shape of the recovery. Our view here is that it will be fairly underwhelming. Our assumption, and it’s no more than that, is for a 3% lift in prices over calendar 2024.
_________________________________________________________________________________________________________________________________
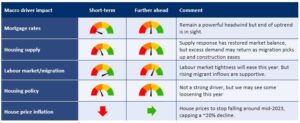
Impact of macro drivers of our house price view
The table below summarises the various drivers of house price inflation and their impact on our view.
Where are we now?
After soaring just over 40% in the year and a half from February 2020 to November 2021, average house prices in New Zealand have fallen about 16% since.[1] That still leaves them about 19% higher than pre-COVID levels.
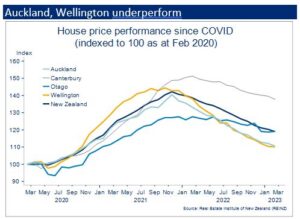
There’s been plenty of regional variation around the national average (chart below). Those house prices that got the most ‘stretched’ – namely Wellington and Auckland – have been subject to a sharper valuation snap-back. The larger falls in the bigger cities are also consistent with the theory that house prices in more expensive areas tend to be more sensitive to changes in interest rates.[2]
[1] Of the many metrics available, we favour the monthly REINZ Stratified House Price Index. It’s timely, and adjusts for changes in sales composition.
[2] For example, see here from the Reserve Bank of Australia.
The decidedly boom-bust nature of the recent NZ house price cycle mostly reflects similarly sharp swings in mortgage rates, against generally tight supply. But adding weight to the downward leg of the correction has been a tightening in some housing policies, and two years of stalled population growth.
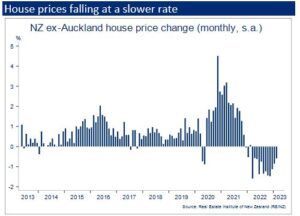
Interpreting the very recent housing market tea leaves is difficult given the impacts from recent North Island weather devastation. But we have seen evidence over the past few months that the pace of the downturn is at least easing. This after fifteen straight months’ worth of house price declines. We saw a decent bounce in January home sales (seasonally adjusted). And, ex-Auckland, the slowing in the rate of house price contraction continued in February (chart below).
Where are we going?
Despite this, it’s too early to declare the downtrend over. Higher mortgage rates are still working their way through the system and the disruption from the North Island weather disasters will supress housing activity relative to what would have otherwise occurred.
Mortgage rates are #1
The number one pre-condition for a levelling off in the house price correction is the end of the mortgage rate uptrend. That’s not necessarily a fall in mortgage rates, but at least the end of the increases.
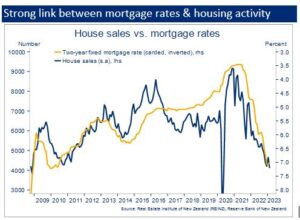
Once that happens, buyer confidence would be expected to improve, lifting housing activity off the floor which would, in turn, feed through to house prices three or so months later. That’s the usual lag between changes in mortgage rates/activity and prices.
So, to be consistent with our view of a roughly mid-year bottoming in the house price cycle, we’d have to see mortgage rates and house sales level off pretty soon. We’re okay with that, but clearly any delay would push the expected house price recovery later into 2023.
Labour market speed bump a risk
The past year or so’s house price fallout would have been more negative were it not for the rock-solid labour market. Full employment and record wage growth have ensured forced sales and mortgage-related stress have remained at very low levels.
The question is, then, what happens to the housing market when labour market strength eases this year, as we expect?
This is probably the biggest downside risk confronting our forecasts. In essence, we’re anticipating a turning in the house price cycle just as a domestic recession begins to take hold and unemployment starts to rise. It’s certainly possible that these factors could cause recent housing market green shoots to wither, and we see prices continue to slip southwards through all of this year.
The fact that this is not our central forecast reflects:
- A relatively mild deterioration in the labour market by historical standards. We see the unemployment rate rising to around 5.5% by the end of 2024, and that’s from a starting position of extraordinary stretch.
- The anticipated slackening in the labour market is expected to be more about additional labour supply turning up than widespread job losses.
Importantly, this extra labour supply is expected to be delivered largely by inward migration which, itself, may support the housing market.
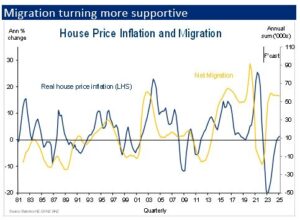
Indeed, the rapid turn in the migration cycle means it’s already at levels that have historically coincided with upward pressure on real house prices (chart above). The relationship is far from stable, and migration data are pretty unreliable, at least at first read. But we do think the uptrend has legs and will continue.
Supply response to limit upturn
Assuming we do see house prices level out this year, attention will quickly shift onto what sort of recovery we can expect. Our long-held view is that it will be fairly underwhelming. Certainly not the roaring, speculative excess of 2020, for example. Our forecast assumption, and it’s no more than that, is for a 3% lift in prices over the course of calendar 2024.
First, while we expect mortgage rates to soon stop rising, they are likely to remain at higher levels than the past few years as the Reserve Bank seeks to stamp out too-high inflation.
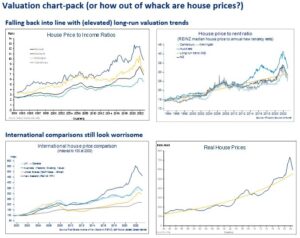
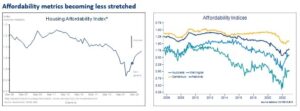
Second, the message from our suite of valuation and affordability metrics is that house prices are now less out-of-whack than they were, but are still far from “cheap”. International house price comparisons are particularly confronting.
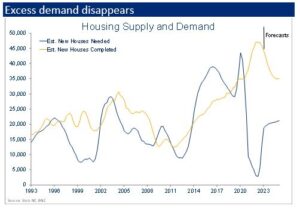
Finally, and most importantly, we’ve seen a strong supply response. Unsold inventory is now twice what it was in the spring of 2021 (realestate.co.nz data).
We’re not big on housing shortage estimates – there are just too many moving parts to get a steer that’s in any way accurate. But what we do know is that whatever shortage there was pre-COVID has been materially, if not entirely, eroded. This thanks to the stalled population growth and booming construction of the past few years. We’re cognisant that this may change now that migration is picking up again, but the starting point is at least much more balanced.
What about housing policies?
With house prices falling back toward the Reserve Bank’s assessment of ‘sustainable’, and mortgage lending having slowed to a crawl, some are wondering whether we’ll see an easing in the Reserve Bank’s loan-to-value (LVR) restrictions this year.
Our sense is that there’s a reasonable chance of such. But there’s also no rush. The house price correction has been fairly orderly so far. There’s also been a passive easing in the amount of credit the LVRs are restricting. With house prices lower, a given deposit stretches a little further. This means a prospective home buyer that might have previously been classed as “high-LVR”, may no longer be.
However, should the pace of the housing correction intensify, the Bank won’t want a restricted credit supply to starve the market of oxygen, risking a harder landing. We think the bank can also draw comfort from the fact an easing of LVR restrictions would be unlikely to spark another flurry of housing activity like in 2020. The other macro ‘negatives’ in play – much higher mortgage rates and a more balanced supply picture – would be expected to dominate.
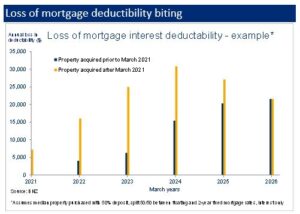
Mortgage interest deductibility is also a topic of discussion. Particularly now that the removal of deductibility for investors is starting to bite a little harder as interest rates have moved up (chart opposite). This is something that might keep investors cautious in the run-in to the October election.
_________________________________________________________________________________________________________________________________
Regional round up
Our housing market ‘heatmap’ provides a snapshot of the relative strength of housing markets around the country.
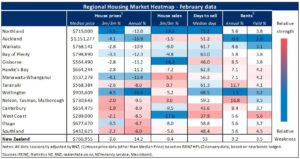
- There’s an obvious cool patch across the north and eastern parts of the North Island. Part of this clearly reflects recent weather devastation in Gisborne and the Hawke’s Bay. House prices in the North Island had already been falling by more than elsewhere though, and no more so than in Auckland and Wellington.
- A clear regional pattern isn’t as obvious in indicators of housing activity – house sales and days to sell – as in prices. But the heatmap is generally ‘warmer’ in the top of the South Island and lower parts of the North and, going somewhat against the grain, Auckland. Indicators of housing activity tend to lead house prices by a few months. So, all else equal, this implies a better base of support for prices in these areas relative to elsewhere.
- Growth in rents (data from new bonds lodged) has been strong nearly everywhere, but we note some small falls recently in Auckland.
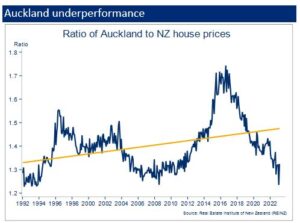
- Looking ahead, we’re on the lookout for signs of stabilisation in the Auckland and Wellington markets, as bellwethers for the rest of the country. These markets are still the least affordable, despite experiencing the largest house price corrections to date. However, because of the latter, the ratios of Auckland and Wellington house price ratios to NZ are close to the bottom end of recent ranges (chart opposite). This might suggest a change in this trend underperformance is not far away. Auckland would also be expected to benefit relatively more from the recent upturn in migration. By the same token though, if interest rates were to take another leg higher, we’d expect Auckland and Wellington to again suffer relatively more.
- Finally, following the damage to the housing stock from recent weather devastation, we may see upward pressure on rents and house prices in Hawke’s Bay and Gisborne in coming months. The fact the supply of housing was already extremely tight in these regions won’t help – Gisborne has experienced some of the strongest growth in rents of anywhere in the country over the past three years
_________________________________________________________________________________________________________________________________
_________________________________________________________________________________________________________________________________
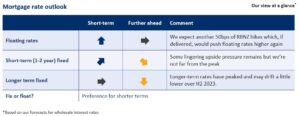
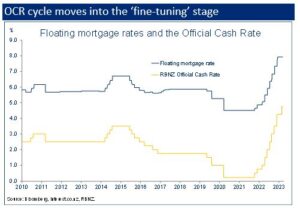
Floating rates
Floating mortgage rates have risen around 350bps since the Reserve Bank began lifting the Official Cash Rate in mid-2021. Based on the BNZ economics team’s expectation that the Bank will lift the OCR another 50bps this cycle, the rise in floating mortgage rates has a little further to go. We should add that the risks to this view are moving to the downside, in the wake of recent financial markets turbulence offshore.
Once the peak OCR is reached, we’re likely to see a period of stability as the RBNZ waits for higher rates to do their work in weeding inflation pressure out of the system. Just how long this period lasts is highly uncertain, but our projections don’t incorporate cuts in the cash rate until May 2024.
Fixed rates
As the end of the interest rate hiking cycle comes into view, the outlook for fixed mortgage rates becomes a little more nuanced. It’s less about a ‘rates up/rates down’ dynamic as it is about the varying outlooks for different mortgage rate terms.
In the past few months, we’ve seen rates for two years and longer trimmed a little, with rates for shorter terms continuing to nudge higher. As a result, the mortgage curve is very slightly ‘inverted’ – longer-term rates below short-term rates (see chart below).
Based on our projections for wholesale interest rates, this inversion dynamic may have a little further to run. Shorter-term (1-2 year) wholesale and retail rates typically peak around the end of the Reserve Bank’s tightening cycle. We’re not quite there yet but we’re getting close. Indeed, local economic data and offshore events are, if anything, starting to point toward an earlier tools-down than the final hike in May that’s baked into our forecasts.
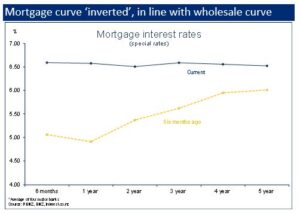
Meanwhile, longer-term (3+ year) fixed rates have likely already peaked. That’s because rates for longer-terms not only price in the last stretch of the interest rate up-cycle, but also more of the cutting cycle on the other side. As the year progresses, these rates will factor in more of the expected cutting cycle, causing rates to slowly fall.
Fix or float?
We’d note at the outset that getting a mortgage strategy “right” is more about ensuring it suits a borrower’s individual financial needs and requirements for certainty, than necessarily trying to pick where mortgage rates are headed. The latter is fraught with difficulty.
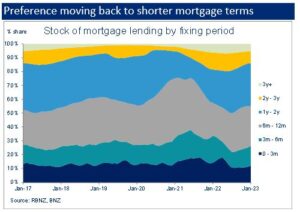
It’s worth having a look at RBNZ data to see what people have been doing. Generally, the trend has moved towards opting for shorter fixed-rate mortgage terms. The chart shows that the share of mortgage borrowing on longer-dated terms has been edging lower since mid-2022, with shorter terms rising in popularity again. That reverses the trend that kicked off in early 2021, and presumably reflects an expectation that mortgage rates are at or around the peak.
With the mortgage curve flat or slightly “inverted”, the considerations facing new borrowers are:
- Fix for a longer time period (3-5 years) at a slightly lower rate, thus gaining certainty over mortgage payments for a longer time period but also potentially missing out on the opportunity to roll onto a lower rate in future, should interest rates start to fall over the next few years.
- Fix for a shorter term at marginally higher rates, involving less certainty over long-term interest payments, but retaining the ability to roll onto lower rates in coming years, should they transpire. The latter is far from certain but the odds of such have gone up recently in our estimation.
Drawing on our days in treasury risk management, we’d also add that it’s generally prudent not to lengthen borrowing terms close to potential turning points in the economic/interest rate cycle.
With all of this in mind, we have no beef with the recent trend towards shorter mortgage fixing terms.
_________________________________________________________________________________________________________________________________
To subscribe to Mike’s updates click here
_________________________________________________________________________________________________________________________________
Disclaimer: This publication has been produced by Bank of New Zealand (BNZ).
This publication accurately reflects the personal views of the author about the subject matters discussed, and is based upon sources reasonably believed to be reliable and accurate. The views of the author do not necessarily reflect the views of BNZ. No part of the compensation of the author was, is, or will be, directly or indirectly, related to any specific recommendations or views expressed.
The information in this publication is provided for general information only, and is a summary based on selective information which may not be complete for your purposes. This publication does not constitute any advice or recommendation with respect to any matter discussed in it, and its contents should not be relied on or used as a basis for entering into any products described in it. BNZ recommends recipients seek independent advice prior to acting in relation to any of the matters discussed in this publication, including legal, financial and tax advice. This publication is intended only for the person in New Zealand to whom it is sent by BNZ, and must be treated as strictly confidential. Any statements as to past performance do not represent future performance, and no statements as to future matters are guaranteed to be accurate or reliable. To the maximum extent permissible by law, neither BNZ nor any person involved in this publication accepts any liability for any loss or damage whatsoever which may directly or indirectly result from any advice, opinion, information, representation or omission, whether negligent or otherwise, contained in this publication.