Property Pulse: Moving on…. up
7 Jun 2023
- The mid-year end to the house price correction we’ve been talking about appears to be upon us.
- We see house price growth resuming over H2 2023 and have nudged up our forecasts for 2024.
- But we’re not getting carried away. Still-high mortgage rates, stretched affordability, and sluggish economic conditions all look set to hold back the upturn.
- Short-term mortgage rates are likely to be pinned around current levels for some time.
Welcome to our second Property Pulse. Supporting our more regular EcoPulse updates, the idea here is to take a more detailed look at all things housing. We also dip into mortgage rate dynamics.
________________________________________________________________________________________________________________________________
The view, in brief
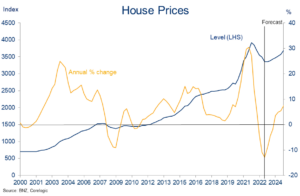
Our long-held view has been that NZ’s house price correction would run out of steam around the middle of this year, with prices 15-20% below the 2021 peak. Our confidence in such has grown to the point that we’re now sticking a fork in the correction and calling it as roughly done at levels around 16% below the peak.
We now see house price growth resuming over the second half of this year. But only at modest rates of around 1-1½% per quarter. That is, we remain of the view that still-high mortgage rates, stretched affordability, and sluggish economic conditions will all constrain the extent of the upturn. We see annual house price inflation at -2% by the end of this year (from -12% currently), rising to +7% over calendar 2024.
It’s worth reiterating the usual health warnings around any house price forecast. We see large risks on both sides of our view, but reckon they’re roughly evenly distributed either side of our updated projections.
________________________________________________________________________________________________________________________________
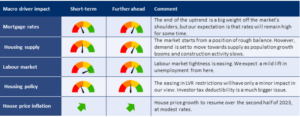
Impact of macro drivers of our house price view
The table below summarises the various drivers of house price inflation and their impact on our view.
Calling time
We think the house price correction is over. We’ve been flagging as much in our recent EcoPulse updates, but we’ve now formalised it in our forecasts.
This is not to rule out the possibility of some near-term jostle in the month-to-month housing numbers which, by all accounts, remain choppy. Some regions may also lag the tentative upturn that, we think, is likely to show up first in Auckland.
But the bigger picture is that the house price correction that began in November 2021 and has so far extended to a peak-to-trough decline of 16% (REINZ House Price Index) appears to be behind us. Bear in mind that, if we’re right on this, NZ house prices would be levelling out at still very high levels. About 20% up on pre-COVID levels in fact, and still elevated on any number of valuation metrics (see valuations chart-pack).
Mortgage rate flattening assists
As far back as November, we were suggesting a mid-year flattening in mortgage rates would help bring the house price correction to a close around the same time.
This now looks all the more likely following the Reserve Bank’s recent decision to call time on its interest rate hiking cycle. We strongly concur.
Pipeline tightening
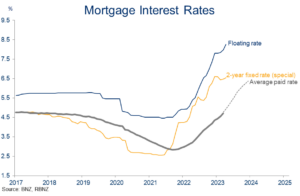
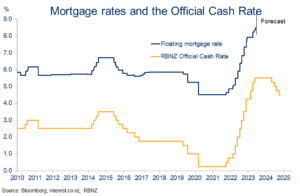
Much higher interest rates are indeed doing their job in weeding excess inflation pressure out of the NZ economy. And don’t forget there’s still plenty of tightening to come down the pipe. That is, even though the Official Cash Rate has stopped rising, the average interest rate paid by mortgage holders is likely to keep rising right through the remainder of this year (chart opposite).
We’ve been characterising the RBNZ’s tools-down more as removing a source of downward pressure on house prices than something likely to provide a strong boost. After all, RBNZ data show the major banks are testing new borrowers on 8.5-9.0% mortgage rates, and rates don’t look like they’re going to come down anytime soon (see mortgage rate section).
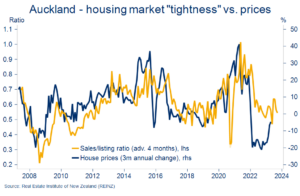
Still, the light at the end of the mortgage rate tunnel is likely to help lift buyer confidence off the floor and, in turn, assist the nascent recovery we’ve seen in various housing activity statistics like monthly turnover and days to sell. Even at current levels, sales-to-listings ratios – a proxy for the demand/supply balance in the housing market – are suggestive of a stabilisation in prices (chart below).
Signs of life
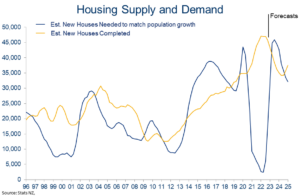
Extra population will add to housing demand
If mortgage rate dynamics have played out loosely as expected, population dynamics have not. The extraordinary boom in inward migration numbers is turning out to be a game-changing development for the economy, and it certainly has implications for the housing market.
The surge in residential construction of recent years had, in combination with closed borders, restored balance to a market that, pre-COVID, was probably undersupplied to the tune of 50-100k dwellings.
Now, with population growth surging again and construction activity slowing, we’re, conceivably, in the process of moving back into a position of excess demand for housing. Our rough projections have incremental demand nudging above incremental supply over 2024.
Gap reopens
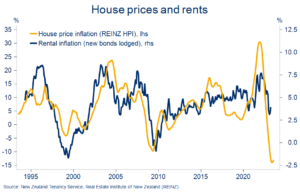
The extra pressures on housing resources is likely lead to upward pressure on prices and rents. The extent of such is anyone’s guess. Rents would be expected to move first and we’ve indeed seen early signs of a turning in the trend here (chart below). The anecdote, particularly in Auckland, is certainly consistent with a pop in demand for rental accommodation.
Rental price inflation turning
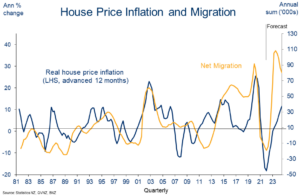
The house price implications are essentially a guess on the extent to which the usual cyclical relationship with net migration continues to hold. This can be seen in the chart opposite. The correlation is strong but not perfect, and we’ve assumed a wedge between the two is maintained. This largely reflects uncertainty about the sustainability of the boom.
Upward pressure
End of correction does not a boom make
The weight of the above adds up to a picture where the downward pressure on house prices will soon give way to pressure on prices to rise.
The next question, naturally, is by how much? We’ve pencilled in gains of around 1½% per quarter, on average, from Q3 of this year through 2024. In other words, we’ve retained our expectation that the upturn will be fairly tepid. The end of the downturn does not a boom make. There are still some stiff headwinds facing the housing market, namely:
- Mortgage rates are set to remain around current high levels for some time. This, and the more general cost of living crimp on incomes, means the serviceability burden on new borrowing will remain high.
- Despite the sizeable correction of the past 18 months, NZ house prices are far from ‘cheap.’ Valuation metrics (see appendix) show that the degree of stretch to anchors like rents, incomes, and offshore equivalents has reduced but remains elevated.
- The economy isn’t in a great spot. Growth is recessionary, and the labour market is set to deteriorate. The fact we’re comfortable forecasting a small house price recovery in this environment reflects the fact our projected lift in the unemployment rate is relatively mild, and is driven more by extra labour supply than widespread job losses. But should things turn out worse than we’re expecting, we’d expect the housing market green-shoots to wither pretty quickly.
Mortgage rate outlook
_______________________________________________________________________________________________________________________________
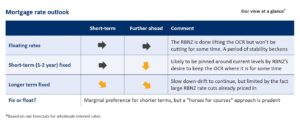
Floating rates
Floating mortgage rates have risen around 400bps since the Reserve Bank (RBNZ) began lifting the Official Cash Rate (OCR) in mid-2021. Based on our expectation the RBNZ won’t need to lift the OCR again this cycle, current floating rates around 8.50-9.00% should mark the peak.
We’re now likely to see a period of stability in floating rates as the RBNZ waits for higher rates to do their work in scrubbing out inflation pressure. Just how long this period lasts is highly uncertain, but our projections don’t incorporate cuts in the OCR until May 2024. That’s about six months earlier than the RBNZ is projecting.
Sideways then down
Fixed rates
Movements in fixed mortgage rates reflect expectations of where the OCR will go in future – as embedded in wholesale interest rates – and bank funding costs. So, while the OCR has likely peaked, we could still see some upward tweaks to some mortgage rates given recent lifts in wholesale rates and bank funding costs.
Those could be expected to be relatively small fry though in the scheme of the uptrend to date. The broader picture is one in which the uptrend has broadly done its dash and the timing and extent of RBNZ rate cuts will become the bigger driver of where fixed mortgage rates go from here.
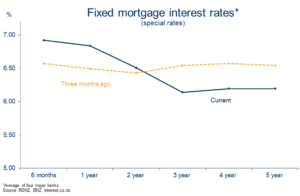
In the past few months, we’ve seen a continuation of the “inversion” mortgage rate trend along the lines of our prior expectations. The curve has essentially pivoted around the two-year term. Rates for terms shorter than two years have increased a little further, even as terms greater than two years have continued to edge lower.
A wonky inversion
Based on our projections for wholesale interest rates, we’d expect this trend to soon wind up. Shorter-term rates are unlikely to rise much further but, equally, will be pinned around current high levels by the RBNZ’s desire to keep the OCR where it is for some time.
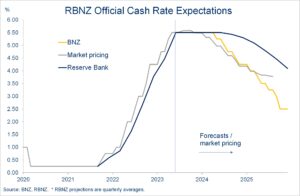
The outlook for longer-term (3-5 year) rates is more uncertain. Yes, they can be expected to slowly fall as the expected OCR cutting cycle draws slowly closer. But much of this is already priced into rates where they are (chart below). And we’ll probably see further speculation – at least for a while – that the RBNZ may yet be dragged back to the rate hiking table, which could provide the odd boost to wholesale rates. It adds up to a picture where longer-term mortgage rates are likely to remain on a declining trend overall, but it will be a bumpy and gradual one.
Market pricing already factoring in rate cuts
Fix or float?
It’s worth reiterating that getting a mortgage strategy “right” is more about ensuring it suits a borrower’s individual financial needs and requirements for certainty, rather than trying to pick where mortgage rates are headed. The latter is fraught with difficulty.
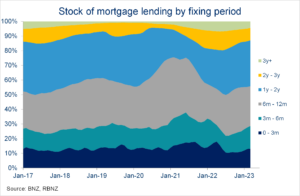
Over the past three months or so, we’ve seen an increasing preference for shorter fixed-rate mortgage terms (chart below). That presumably reflected a growing expectation that we weren’t far from the peak and borrowers would be able to roll off those shorter terms onto lower rates.
Slow grind towards shorter terms
But with a wider variation in rates across fixed-terms available now (refer chart on previous page), the fixing decision now looks less clear-cut.
For example, three-year fixed rates – the lowest point on the curve currently – are some 70bps below rates for one-year terms. That’s quite a change from a quarter ago when the rates were basically all the same. Mortgage fixing considerations are now thus:
- Fix for a shorter term at slightly higher rates, effectively ‘buying’ the potential to roll onto lower mortgage rates in future – should they transpire. The latter is far from certain but the odds of such have gone up recently in our estimation thanks to the RBNZ’s tools down, and evidence inflation pressures are abating.
- Fix for a longer time period (e.g. three years), thus obtaining extra certainty and lower mortgage payments now, but potentially missing out on the opportunity – relative to shorter-terms – to pay lower rates later on, should short-term rates start to fall.
In essence, one-year rates, say, need to fall a reasonable amount over the coming few years to make it economic to fix for a series of one-year terms rather than, say, fixing for three years now.
Based on our OCR view we see a good chance this ‘break-even’ hurdle is satisfied and shorter-term rates may thus continue to be preferred. However, there’s sufficient uncertainty around this outcome such that a horses for courses approach is warranted.
To subscribe to Mike’s updates click here
________________________________________________________________________________________________________________________________
Disclaimer: This publication has been produced by Bank of New Zealand (BNZ). This publication accurately reflects the personal views of the author about the subject matters discussed, and is based upon sources reasonably believed to be reliable and accurate. The views of the author do not necessarily reflect the views of BNZ. No part of the compensation of the author was, is, or will be, directly or indirectly, related to any specific recommendations or views expressed. The information in this publication is solely for information purposes and is not intended to be financial advice. If you need help, please contact BNZ or your financial adviser. Any statements as to past performance do not represent future performance, and no statements as to future matters are guaranteed to be accurate or reliable. To the maximum extent permissible by law, neither BNZ nor any person involved in this publication accepts any liability for any loss or damage whatsoever which may directly or indirectly result from any, opinion, information, representation or omission, whether negligent or otherwise, contained in this publication.