Eco-Pulse: The economy in (ten) pics
27 Mar 2024
- Rolling recession continues
- More to go
- But some light on the horizon
- OCR cuts from November
Chart 1: ‘Merica!
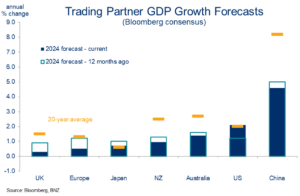
The world economy is looking a little less bleak. In a break with recent tradition, pundits have even started to nudge global growth forecasts upwards.
It’s the US that’s doing the heavy lifting here. That’s good news for the global economy (the US accounts for ~25% of global GDP), but less so for NZ directly (the US takes about 15% of our exports).
Moreover, growth forecasts for our other key trading partners remain sub-par. It’s part of the reason we’re cautious on how far the recent lift in our commodity export prices can run.
Chart 2: NZ’s rolling recession…rolls on
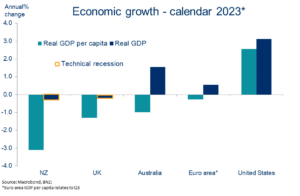
Meanwhile, NZ’s ‘rolling recession’ that began in late 2022 rolls on. Last week’s 0.1% GDP decline for the final quarter of 2023 was the fourth quarter of the last five to feature a negative sign.
On a per capita basis, it’s a lurch backwards of a size not seen since the 2009 global financial crisis. Global comparisons don’t look pretty. Part of it is timing – we’re bouncing along the bottom of the business cycle. We think there’s another six months or so of this to go.
Chart 3: Retail reversal
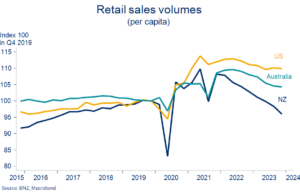
Where are the pain points? It’s hard to go past retail. The volume of purchases leaving shop floors has gone backwards for eight consecutive quarters (data to Q4 2023).
That’s despite the strongest population growth since 1947. Per-capita retail sales volumes are thus back down around 2017 levels. A comparison to the US and Australia simply underlines this weakness.
Chart 4: (De)construction
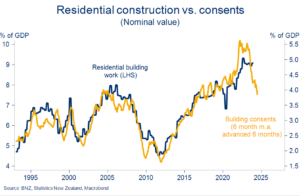
Residential construction is another sector at the coalface of the slowdown.
A 30% slide in building consents sets the stage for a sharp decline in activity this year. Building costs have soared (35% in three years), existing house prices have fallen (13% below 2021 peak), and interest rates are highly restrictive. Together, these factors mean the macro-level maths of building just don’t add up.
Chart 5: Stress metrics rising but contained
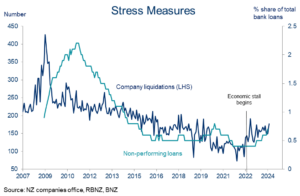
Against this backdrop, there’s more attention on measures of stress and fragility. We’ve pulled out a couple of examples – company liquidations and (system-wide) non-performing loans.
The trend in both is clearly upward. Further increases appear likely. But the overall level is still low when viewed in historical context. We’re certainly a long way from the levels prevailing during the last big (2008/09) recession.
Chart 6: Light on the horizon
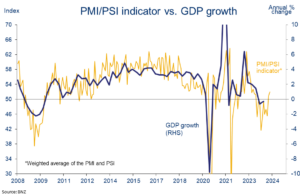
We’re down in the uncomfortable part of the business cycle, but it won’t last forever. There’s light on the horizon, according to some of the forward- indicators.
For example, our PMI/PSI indicator[1] recently crept back above the 50.0 level consistent with expansion in the services/manufacturing sectors. The prospect of it sticking around these levels supports our view the economy will stutter back to life over the second half of this year.
Chart 7: Falling inflation helping confidence
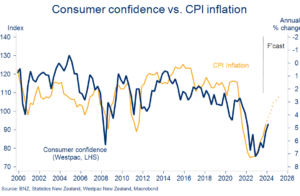
Supporting the above, businesses are also feeling less negative about their lot. Consumer confidence, by contrast, remains bogged down. The gloom has eased though. Last week’s Westpac McDermott Miller index put confidence at two-year highs, albeit with pessimists still outnumbering optimists.
For this cycle particularly, confidence seems to be a vote on the cost of living. And so as inflation has retreated from 7%+ highs, confidence has come back from the brink. If our inflation forecasts are ballpark correct (2.9% y/y by year-end) this trend might have further to run.
Chart 8: Migration cooling
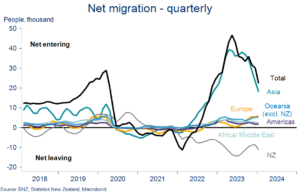
Inbound migrant flows are still large, but it’s clear enough that the peak is behind us. The high watermark for annual net inflows appears to have been hit in November (at an estimated 141,000).
More recent figures depict a clear tailing off in arrivals, particularly from Asia. Rising (net) departures from NZ are further reducing overall net inflows.
The absolute numbers may well get revised up, as has been the tendency, but it makes sense migration is now easing. It’s likely to keep falling this year as job opportunities dry up and the economy underperforms Australia and elsewhere.
Chart 9: Labour market slackening
Migration flows may be past the peak, but the impact on the labour market will endure. Any number of labour market indicators are now saying there’s an excess of labour supply, a remarkable turnaround from the extreme tightness of 18 months ago.
We’re bracing for a lift in the unemployment rate from 4.0% to something closer to 5.5% by year end. Attendant declines in labour turnover, poaching, job security, and wage growth will all contribute to a much different feel to the labour market this year.
Chart 10: Rates of change
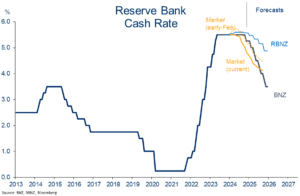
Interest rate expectations have been on a wild ride already this year. Markets have well and truly moved on from February’s rate hike anxieties. Now, it’s all about gunning for an early (August) rate cut.
Through all of this, our own OCR forecasts have remained something of a middle ground. We’ve long signalled an H2 2024 start to the easing cycle, believing the economy and labour market would buckle earlier than RBNZ and consensus reckons. That seems to be happening, albeit with inflation niggles still muddying the waters. We continue to stick with a first cut in November.
[1] GDP-weighted average of the Performance of Manufacturing and Performance of Services indices.
| Disclaimer: This publication has been produced by Bank of New Zealand (BNZ). This publication accurately reflects the personal views of the author about the subject matters discussed, and is based upon sources reasonably believed to be reliable and accurate. The views of the author do not necessarily reflect the views of BNZ. No part of the compensation of the author was, is, or will be, directly or indirectly, related to any specific recommendations or views expressed. The information in this publication is solely for information purposes and is not intended to be financial advice. If you need help, please contact BNZ or your financial adviser. Any statements as to past performance do not represent future performance, and no statements as to future matters are guaranteed to be accurate or reliable. To the maximum extent permissible by law, neither BNZ nor any person involved in this publication accepts any liability for any loss or damage whatsoever which may directly or indirectly result from any, opinion, information, representation or omission, whether negligent or otherwise, contained in this publication. |


