Eco-Pulse: Four things
15 Jul 2024
- RBNZ calls time on tightening bias…
- …as economic activity indicators crumble
- Inflation job almost done
- Employment under pressure
There’s been a bit on over the past week or so. Here are our four key takeaways.
1. RBNZ calls time on tightening bias…
If there was a surprise in the Reserve Bank’s (RBNZ) greenlighting of early rate cuts last week it was only in the timing. We’ve long been of the view the economy is buckling, inflation is beaten, and rate cuts would ultimately be delivered much earlier than RBNZ projections.
It was a matter of when not if. And it appears the deluge of extraordinarily weak economic data we’ve received over the past few weeks has prompted the change.
Cuts front-loaded
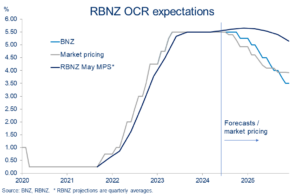
The RBNZ’s newly-adopted easing bias means that in our view all remaining meetings in 2024 are ‘live’ for a possible cut in the Official Cash Rate. November is our central forecast. But there is a reasonable chance that a cut either comes earlier or, if the Bank does wait it out until November, it kicks things off with a larger, 50bps cut.
It’s worth noting that the RBNZ has delivered a decent easing in financial conditions already. The NZ dollar (TWI) is almost 1% below levels prior to the RBNZ meeting, wholesale interest rates are down 15-30bps, and some mortgage rates have fallen already. More of the latter looks likely, absent a nasty surprise from this week’s important Q2 CPI inflation figures. We expect a fall to 3.5%, from 4.0% the prior quarter.
2. …as economic activity indicators crumble
From how we’ve been reading things, the RBNZ’s pivot couldn’t come soon enough. There is a growing chorus of startlingly weak forward indicators that, at face value, warn of a crumbling in economic activity over the second and third quarters.
The June readings of the Performance of Manufacturing (PMI) and Performance of Services (PSI) indices certainly fit into this category. The prior month declines in these indices were of such a magnitude that we’d wondered if some sort of pause was in the offing this time around.
It wasn’t to be. The additional, sizeable declines in the month of June put the PMI at the lowest level since the GFC (outside of lockdown months), and the PSI at the weakest level in the 17-year history of the series (again, outside of lockdown months).
NZ strays southwards
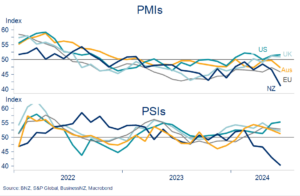
If that wasn’t enough, the speed at which particularly the PSI has cratered since February is cause for additional concern. It’s been faster than the 2008/09 GFC and may not be over yet.
Globally, manufacturing has been under pressure for some time. NZ’s PMI has been sub-50 for sixteen consecutive quarters. Until recently, the services sector, as represented by the PSI, had been key in propping up the broader economy. But the February-June slide has flipped that narrative. A quick comparison to some of our trading partners, as in the chart above, simply highlights the point.
There are multiple drivers of this service sector weakness. At the heart of it is the malaise in retail spending. But the flattening tourism recovery, sub-par housing activity, and reduced government spending are all clear drags.
We also get the sense falling population growth is exposing a few more cracks in the economy. It’s the flipside of the temporary gloss population growth put on some of our macro numbers as it boomed through late 2022 and 2023.
May figures released last week confirmed the migration boom is rapidly deflating. Stats NZ estimates a net migration gain of just 1410 people over the month. These monthly estimates need to be handled with care but, whichever way you look at it, net migration is a shadow of its former 10-15k per-month self.
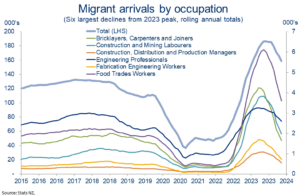
The turnaround in the migration cycle has been a story of both reduced migrant arrivals and, particularly since February, a sharp lift in departures. Drawing on separate arrivals cards data provides a sense of which industries/occupations are contributing most to the fall in arrivals. As the chart shows, construction-related occupations feature heavily.
Reduced demand for construction-related occupations
The slowing migration impulse is one of many factors restraining housing demand. This morning’s REINZ housing stats for June confirmed a picture of a generally moribund housing market. The trend in house prices remains flat, and sub-par activity indicators provided few signs of this changing in the short-term.
None of this is overly troubling for our forecasts. We saw enough back in May to lower our house price expectations to just a 2% lift for calendar 2024. Call it flat. While growing signs of excess supply risk an undershoot of this view, earlier interest rate cuts provide a clear offset.
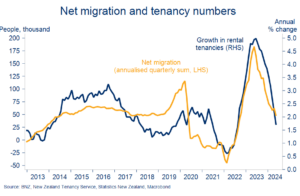
In the rental market, the trend decline in net migrant arrivals has coincided with a marked reduction in new tenancy growth (chart opposite). Slowing income growth from the weakening labour market and the soft housing market are likely also impacting rental demand (the latter as unsold properties get listed for rent).
Rental demand falling
According to last Thursday’s Selected Price Indices, annual rent inflation for the stock of existing tenancies held up at 4.5%y/y in June. However, the tide appears to be turning and this measure should soon turn lower.
Measures of rent inflation on new tenancies – so-called flow measures – are more closely aligned with the current state of supply and demand in the market. These have been falling since the start of the year. The Stats NZ measure of such cooled to 2.5%y/y in June, well off the 7.2% September peak and last month’s 3.8%.
Additional declines look to be in the offing now that prior tightness in the rental market is receding. Our estimates of regional rental vacancy rates confirm a noticeably looser supply picture. Auckland and Wellington now have vacancy rates north of 3.5%, well up from rates of 2.2% and 2.7% a year ago.
Rental vacancy rates rising everywhere
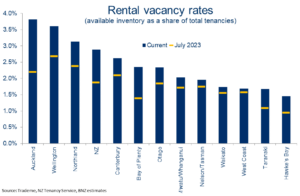
We’d still characterise this as more a picture of rapid normalisation from extremely tight conditions, than one of excess supply. But it’s nevertheless a portent of vastly reduced upward pressure on rents, particularly in the larger cities.
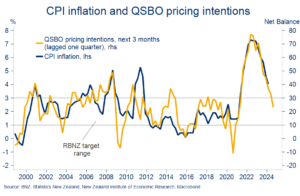
3. Inflation job almost done
That’s helpful for inflation given the relatively high weighting attributed to rents in the Consumers Price Index. It supports our view that CPI inflation should fall rapidly over the remainder of this year and be well within the RBNZ’s 1-3% target range by the September quarter.
That was also the message from last week’s NZIER Quarterly Survey of Business Opinion (QSBO). Not just because the survey’s pricing intentions series, one of the better direct leads on inflation, is now consistent with 2.5% inflation (chart below).
But also because the survey’s various activity metrics confirmed the intense pressure on trading conditions and profitability. There is next to no ability for most firms to pass on widespread price increases in this sort of environment.
Going the right way
4. Employment under pressure
Against this backdrop, firms are unsurprisingly getting more aggressive on the cost cutting front. It’s a common thematic in all of our client discussions and stood out like a beacon in the QSBO survey.
Investment plans were shelved long ago. It’s on the staffing front where changes are afoot. A net 10% of employers now say they will be reducing staff in the September quarter. That’s a sharp flip around from the net 2% expecting to add staff in the prior survey.
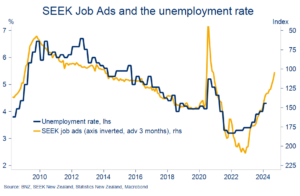
Corroborating evidence of ailing labour demand is starting to mount. According to Stats NZ’s filled jobs measure, no jobs were added in May, on net. Labour turnover has slumped. And an 8% June fall in SEEK job ads in June confirmed the 18-month downtrend in job vacancies is accelerating rather than stabilising (chart below).
More slack in the labour market
Our projections for the unemployment rate to rise to 5½% by the start of next year have, to date, been largely built on expectations of stalled hiring against rising labour supply. The prospect of deeper employment cuts, as seem increasingly inevitable, means the rise in unemployment could occur faster than we’ve allowed for.
The attendant impacts on job security, wage growth, spending intentions, and housing market activity have the potential to insert another layer of weakness into the economy over the second half of this year.
To subscribe to Mike’s updates click here
Disclaimer: This publication has been produced by Bank of New Zealand (BNZ). This publication accurately reflects the personal views of the author about the subject matters discussed, and is based upon sources reasonably believed to be reliable and accurate. The views of the author do not necessarily reflect the views of BNZ. No part of the compensation of the author was, is, or will be, directly or indirectly, related to any specific recommendations or views expressed. The information in this publication is solely for information purposes and is not intended to be financial advice. If you need help, please contact BNZ or your financial adviser. Any statements as to past performance do not represent future performance, and no statements as to future matters are guaranteed to be accurate or reliable. To the maximum extent permissible by law, neither BNZ nor any person involved in this publication accepts any liability for any loss or damage whatsoever which may directly or indirectly result from any, opinion, information, representation or omission, whether negligent or otherwise, contained in this publication.