A bittersweet finish
20 Dec 2024- GDP update reveals larger 2024 crunch
- Even as more timely data suggest we’re past the worst
- Aggressive OCR cuts to continue
- Signs housing market oversupply easing
- BBQ costs undershoot
This is my final Eco-Pulse for 2024. Thanks for reading this year! Have a safe and restful holiday period.
This final week’s worth of economic data does a fitting job of summarising where we’re leaving things in 2024: the economy is (well) down, but the indicators for next year are tilting upwards.
Yesterday’s third quarter GDP update confirmed what most businesses knew some time ago: the middle six months of this year were brutal. GDP growth went backwards a cumulative 2.1% over the second and third quarters. Excluding the COVID period, only once before (1991) have we seen a half year period so weak.
Of note, Stats NZ revised the prior history of the series higher, to such an extent that the size of the economy as at March 2024 was estimated to be 2.3% larger than previously. That will be of little comfort to most, but the overall activity profile we’re left with does line up more readily with what the broader indicators have been saying, not to mention some of the anecdote.
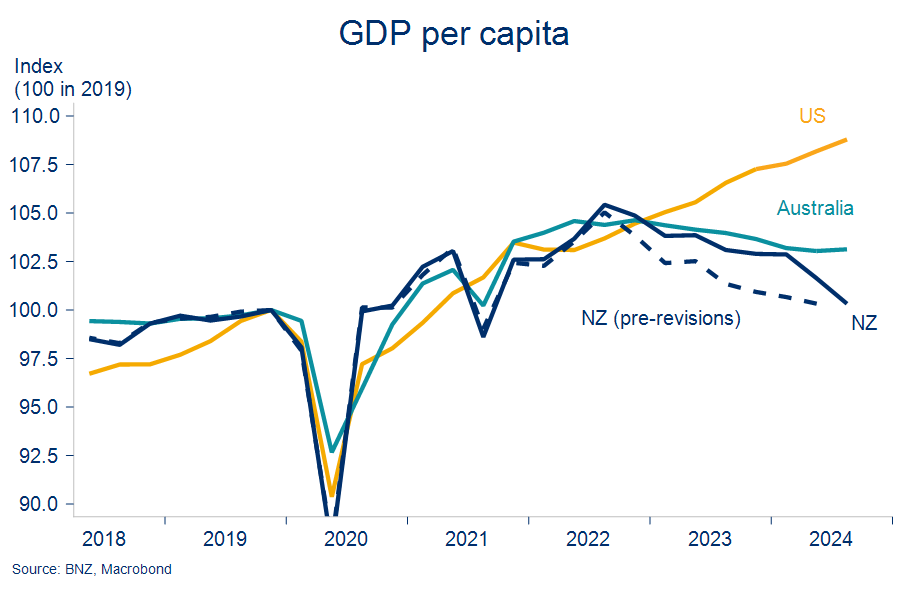
That being, a flatter mid-2022 to mid-2024 period…then crunch. As the chart shows, the picture of underperformance relative to our trading partners remains, but it’s now more concentrated in 2024. The slumping momentum warrants an ongoing aggressive approach to lowering interest rates, and we’ve now formalised a 50bp forecast cut in the cash rate for the February Reserve Bank meeting. Our 2.75% forecast endpoint in the easing cycle remains unchanged.
As ever, GDP figures are dated. Since the third quarter ended the economic data flow has thankfully given off less negative vibes. Enough to keep our forecasts for a sliver of an expansion in Q4 GDP on the board.
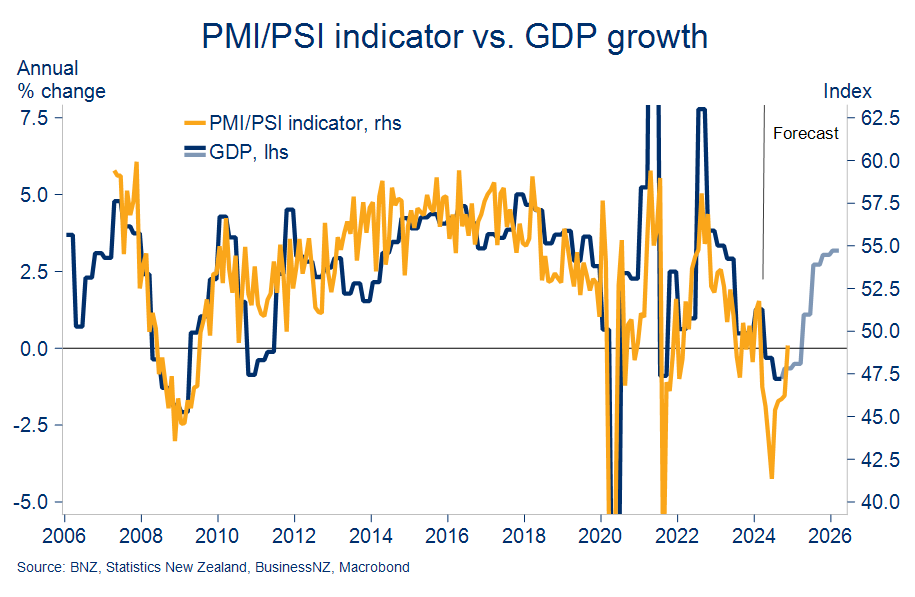
The manufacturing sector remains an important exception. The latest PMI, at 45.5, revealed not only that the sector is still contracting but that it did so at a marginally faster pace in November. The November PSI (Performance of Services index) was less downbeat at 49.5. That’s the highest since February, albeit still (just) south of the 50.0 level indicating expansion.
The most important message for us was that the directional steer from combining the two indices is no longer flashing a red warning sign around our near-term growth forecasts.
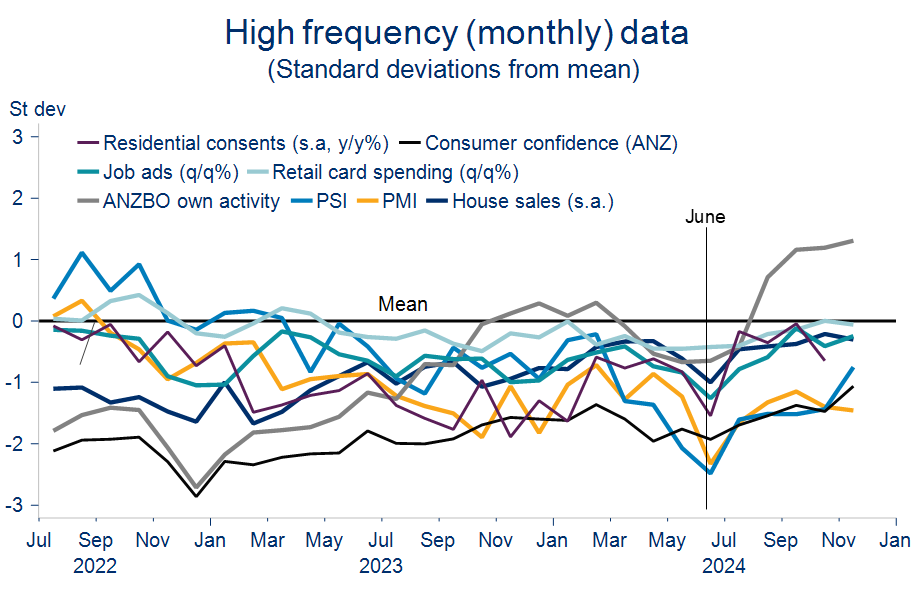
‘High frequency’ indicators more broadly continue to take on less gloomy hues (chart below). November retail card spending consolidated for the fourth straight month. Hardly vigorous, but another steady month helps solidify our expectations the prior downtrend has run its course. The gain in fourth quarter consumer confidence we saw on Wednesday points to a lift in spending next year.
A 1.1% m/m increase in November job ads gave a whiff of the prior declining trend starting to stabilise at a very low level. Meanwhile, business confidence, across nearly all measures, continues to depict a better year in 2025. That’s good news and perhaps not surprising now that GDP figures have confirmed just how sharp the drop was this year.
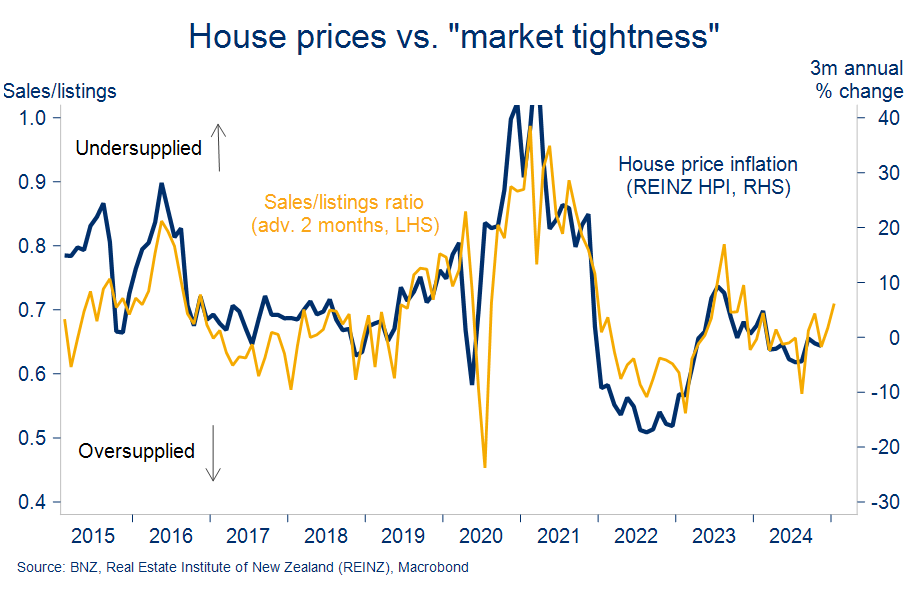
On the housing market, the most notable aspect of Tuesday’s November data was the first sign of a flattening in the past year’s big lift in inventory. Even though the pace of house sales throttled back a touch from October (-2.0% m/m, s.a.), new listings over the month were largely absorbed, rather than adding to the stock of unsold homes.
The sales/listing ratio – an indicator of general market balance – is consequently gesturing in a more northerly direction for house prices (chart below). All of which is in keeping with our house price view, as espoused in our recent Property Pulse.
November’s Selected Price Indices, also out this week, cover about 45% of the Consumers Price Index. The overall balance of the various prices on offer was a touch firmer than we might have expected (particularly a 11% monthly jump in domestic airfares), but not enough to alter our CPI inflation forecast for the final quarter of the year.
Our pick for fourth quarter CPI (released 22 Jan) remains at 0.6% for the quarter, or 2.3% in annual inflation terms. Further ahead, there’s a tonne of balls in the air – the falling NZ dollar, stubborn pricing intentions, falling wage inflation, tariffs? – but our core forecasts have annual inflation holding around this rate for most of 2025.
Expectations of close-to-target inflation, alongside stifled economy momentum, means we remain comfortable with our below-consensus view the Official Cash Rate will fall to a low of 2.75% next year. Wednesday’s news of a more stimulatory fiscal stance (in the year to June), amid the more general deterioration in the deficit outlook, hasn’t affected this view.
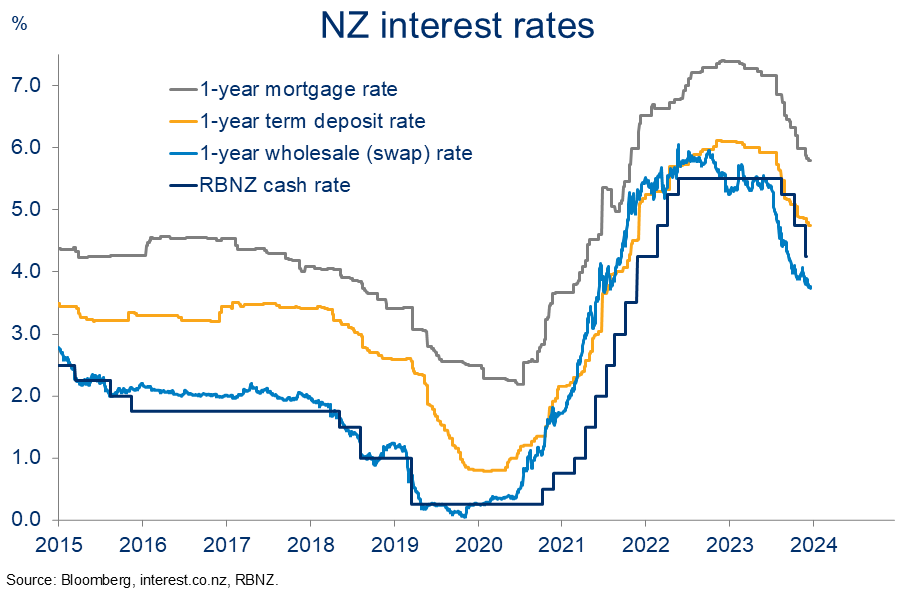
It bears repeating that uncertainty around all of this remains stratospheric as we await the return of Trump to the White House in the New Year as well as some heavy-hitting local data updates. Nevertheless, and in the meantime, we continue to expect downward pressure on particularly shorter-dated mortgage rates to remain.
Finally, and on a lighter note, we bid you a festive summer season in the knowledge that BBQ cost inflation remains well contained.
A cursory selection of ingredients (chart below) from the Selected Price Indices already mentioned shows a large BBQ can be laid on for a little under 3% more than this time last year*. Amongst the components we’ve included, the largest annual cost increase has been for butter (49%), while the price of onions has fallen by the most (-41%).
In the context of the steep food price increases since 2020, the estimated 14% increase in the cost of a BBQ meal over that time has notably undershot both the 24% lift in more general food prices, and the 22% increase in aggregate (CPI) consumer prices.
All the best for 2025.
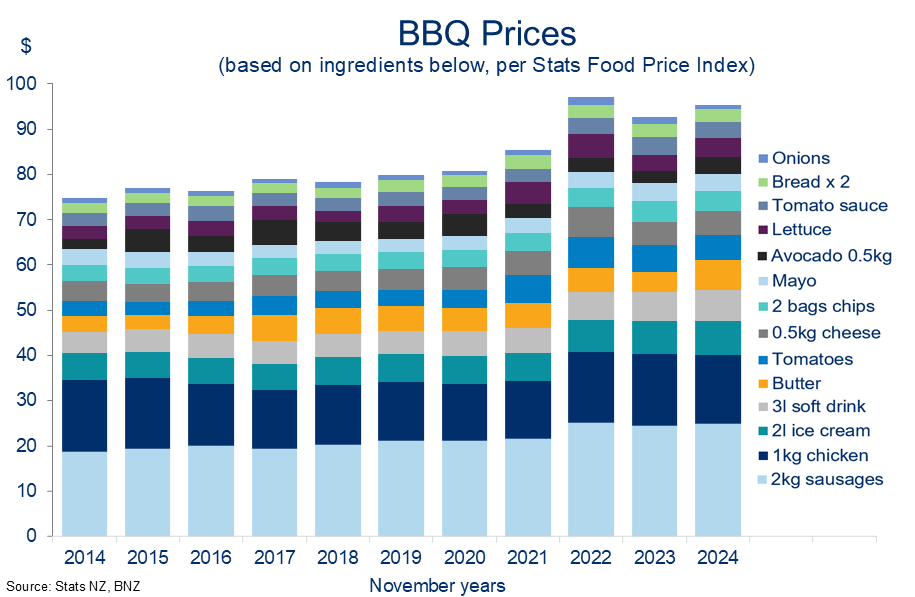
*Results sensitive to preferences on ingredient selection!
To subscribe to Mike’s updates click here
Disclaimer: This publication has been produced by Bank of New Zealand (BNZ). This publication accurately reflects the personal views of the author about the subject matters discussed, and is based upon sources reasonably believed to be reliable and accurate. The views of the author do not necessarily reflect the views of BNZ. No part of the compensation of the author was, is, or will be, directly or indirectly, related to any specific recommendations or views expressed. The information in this publication is solely for information purposes and is not intended to be financial advice. If you need help, please contact BNZ or your financial adviser. Any statements as to past performance do not represent future performance, and no statements as to future matters are guaranteed to be accurate or reliable. To the maximum extent permissible by law, neither BNZ nor any person involved in this publication accepts any liability for any loss or damage whatsoever which may directly or indirectly result from any, opinion, information, representation or omission, whether negligent or otherwise, contained in this publication.


