The economy in ten pics
5 Feb 2025- The ship appears to be turning, slowly
- Dairy cash, retail stirrings will help
- But conflict between future expectations and current reality remains
- Another 50bps cash rate cut awaited
Chart 1: An unfortunate starting point
Far from fighting fit, the economy limps into 2025 carrying some baggage. Two years of rolling recessions have left per capita output 4.8% below the 2022 peak. That’s as at September. The December quarter is looking flattish.
A return to growth beckons this year. But it’s worth bearing in mind the weakened starting point. Some of the hangover effects from the recession – rising unemployment, pockets of financial stress, and pressure on fiscal balances – will remain a feature of the economic landscape this year.
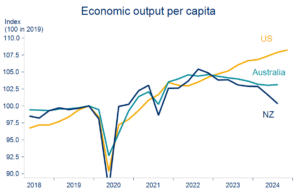
Chart 2: Turning point: expectations vs. reality
The ship may now be turning, but it’s doing so slowly. A chasm remains between economic expectations and current reality.
Confidence in a recovery has soared. But we’re still waiting for it to arrive proper. Indicators referencing the economic here and now remain consistent with stabilisation rather than acceleration. The latest Performance of Manufacturing and Services indices are case in point.
How and when will this gap close? We suspect there will be some convergence on both sides. But the potential for disappointment remains, particularly given events offshore
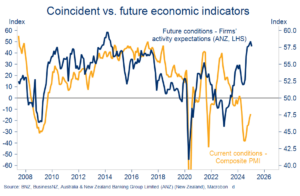
Chart 3: Speed limits
Economic turning points are messy affairs. The many sectors and regions making up the economy have varying leads and lags to the broader cycle. Many are still doing it tough.
As an example, government consumption looks set to play only a bit-part in the expected upturn as tackling a persistent fiscal deficit remains the order of the day. The absence leaves more of the heavy-lifting for the likes of exports, private consumption, and investment.
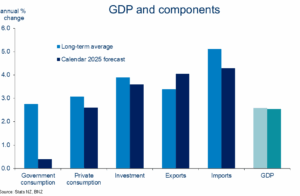
Chart 4: Trading places
All the while the threat and risks of a global trade war shroud the outlook. The share of NZ exports going to the US has been increasing in recent years such that it now (just) edges Australia as our 2nd largest export market. Meat, dairy, and wine are the largest components.
Alongside these direct exposures, it’s the indirect impacts of trade disruptions on the global economy, and China in particular, that may be the bigger risk for NZ. The share of NZ exports bound for China has reduced, but it still takes the equivalent of Australia and the US combined.
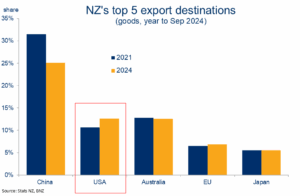
Chart 5: Spending stirs
So where is the impetus for a 2025 recovery? Given its importance, household spending needs to be part of the equation. And card spending figures indeed point to households starting to thaw out their credit cards. Monthly spend has now increased for five months straight.
The expected windfall from lower mortgage rates is a key part of the swelling in spending appetites, even if most of the cash flow impact is yet to hit. More retail pep can be expected as borrowers roll onto lower mortgage rates this year (see Year of the Refix). A weak labour market and stubbornly high costs such as rent, insurance, and rates will likely ensure we don’t get carried away.
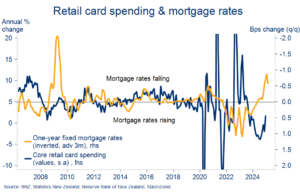
Chart 6: Dairy freed
Dairy is another heavyweight sector heading in the right direction. We recently lifted our Fonterra Milk Price forecasts for this season and next to a healthy $10.00/kgms and $9.50 respectively.
There’s a much higher on-farm cost structure to take account of. But the boost to revenue is worth about $4½b compared to last season. That’s equivalent to about 1% of (nominal) GDP. The low and falling NZ dollar and improving offshore pricing for meat and horticulture exports round out an increasingly positive outlook for many of our primary exports.
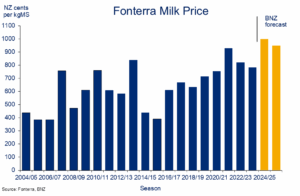
Chart 7: A tale of two islands
A strong house price tailwind has been a common feature of past cyclical upturns. We think we’re in for a more modest lift this time around.
National house prices have been trundling largely sideways for 18 months. But, as ever, the average hides some of the interesting stuff. House prices in Canterbury and Otago have been rising for over 12 months. They’re up 5% and 6% respectively from the mid-2023 cycle low, underlining the more general outperformance of South Island economies.
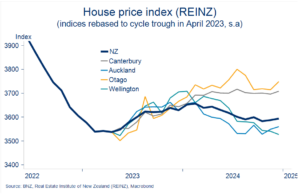
Chart 8: Not at the peak yet
Indicators of labour demand appear to be stabilising. Prior declines in monthly filled jobs have flattened off and hiring intentions have crept back into net positive territory. Perhaps firms are having another look at resourcing ahead of some anticipated expansion this year.
It doesn’t mean the unemployment rate is about to turn lower though. Growth in the labour supply is slowing on the back of much reduced migration flows. But we think it will be late in the year before the pace of jobs growth matches supply. The unemployment rate is consequently expected to rise further from this morning’s 5.1% Q4 read.
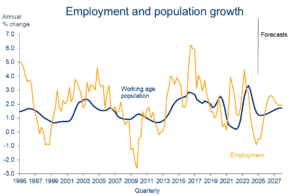
Chart 9: Contained
A continued excess labour supply points to further slowing in wage inflation this year. Figures out this morning showed annual growth in the (private sector) Labour Cost Index cooling to 3.0% in the final quarter of last year. We see it drifting down to around 2.5% y/y by mid-2025.
CPI inflation is likewise seen as well contained overall, notwithstanding the short-term wrinkles from a falling NZ dollar and higher energy prices. Trade tensions ratchet up the uncertainty around any sort of inflation projection. But the overall picture still provides a green light for further interest rate cuts.

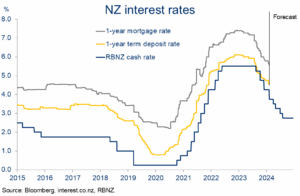
Chart 10: Green light
We haven’t seen anything in the summer data flow likely to prevent the Reserve Bank lopping another 50bps off the Official Cash Rate this month. Markets price it as a near certainty.
The RBNZ’s guidance alongside the rate decision will be most important for the rates outlook as it folds global trade uncertainty, changes in US interest rate expectations and a much lower NZ dollar into the mix. We continue to believe the cash rate needs to fall to at least 3.0%, but acknowledge the heightened uncertainties about pace and timing. It sums to a view where short-term retail interest rates still have reasonable downside, less so those for longer terms.
To subscribe to Mike’s updates click here
Disclaimer: This publication has been produced by Bank of New Zealand (BNZ). This publication accurately reflects the personal views of the author about the subject matters discussed, and is based upon sources reasonably believed to be reliable and accurate. The views of the author do not necessarily reflect the views of BNZ. No part of the compensation of the author was, is, or will be, directly or indirectly, related to any specific recommendations or views expressed. The information in this publication is solely for information purposes and is not intended to be financial advice. If you need help, please contact BNZ or your financial adviser. Any statements as to past performance do not represent future performance, and no statements as to future matters are guaranteed to be accurate or reliable. To the maximum extent permissible by law, neither BNZ nor any person involved in this publication accepts any liability for any loss or damage whatsoever which may directly or indirectly result from any, opinion, information, representation or omission, whether negligent or otherwise, contained in this publication.