Eco-Pulse: Where is everyone?
18 Apr 2023
- Labour markets are still tight everywhere all at once. We take a quick look into why
- But it’s also important to note that change is afoot. Labour market and inflation pressure is slowly being released
- Rising net migration into NZ is a key part of this
- RBNZ springs another surprise. We fine-tine our OCR forecasts, but our mortgage rate & housing views remain unchanged
On the (lengthening) list of challenges facing NZ businesses, finding staff is still right up there. That’s even as cracks in the demand picture start to become more obvious.
Challenges from the still tight labour market repeatedly bubbled to the service in our various client conversations over the past month. Indeed, the number one question we fielded was: “How can every country be short of staff at the same time – where is everyone?”
It’s a fair question. Sourcing talent is that much more difficult when heightened competition for labour is a global phenomenon. Indicative of such, unemployment rates in NZ, Australia, the UK, the US, and Europe are still either at, or not far off, multi-decade lows.
Global employment: low
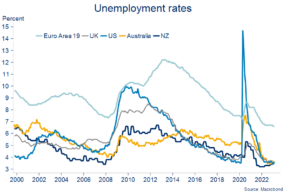
Is there a common explanation? Sort of. It’s now clear that most (developed) countries overdosed on stimulus through the pandemic. The resultant surge in economic activity saw labour demand soar nearly everywhere.
In contrast, experiences around the supply of labour were more mixed. The US and UK, for example, experienced a sharper tightening in labour supply. In essence, a bunch of people in these countries left the labour force[1] during the pandemic and they haven’t come back. No one knows why for sure, but commonly cited factors include: illness, fear of getting COVID, caring for dependents, and early retirement.
As a result, the share of the working-age population in the labour force – known as the participation rate – in these countries remains below pre-pandemic levels. That’s despite a strong recovery in broader labour market indicators.
In the US, the lower participation rate continues what has been a long-term decline, something potentially problematic for the economy. It’s a drag on economic growth and means a smaller share of workers are left to support a growing share of the population outside the labour force (a higher dependency rate).
[1] That is, people either employed or actively looking for a job.
Global participation rates diverge
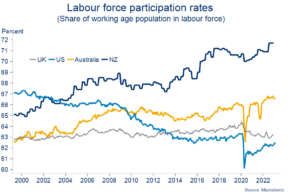
As the chart above shows, NZ (and Australia) didn’t experience this phenomenon. Indeed, quite the opposite. With the NZ borders closed, firms were not able to readily access offshore labour via migration. Instead, surging demand for labour saw workers previously outside the labour force pulled into it in increasing numbers. Part of this was no doubt due to the strong wages on offer, but part was probably also out of necessity as households grappled with the higher cost of living.
By way of comparison, NZ’s available labour force is now about 3% larger than pre-COVID levels, while Australia’s is 4% larger. The equivalent increase in the US is just 1% while the UK’s labour force is about 0.8% smaller.
NZ’s participation rate, already lofty by international standards, rose to a fresh record high of 71.7%. Were it not for this lift in participation, and holding all else equal, we would have likely experienced an unemployment rate down in the “2s”.
Record labour force participation does mean that the ability of NZ firms to keep pulling in help from people previously outside the labour force must surely be close to tapped out.
Migration steps up?
Cue the second most frequent question we’re getting at present: “Will rising net (inward) migration help alleviate local skill shortages?”
It does seem to be helping, but it’s difficult to know by how much. First, because extra migration adds to both the supply and the demand side of the economy. And second, because the data can be wobbly.
Permanent and long-term migrant arrivals have been exceeding departures by 5-10k/month (chart below). But these data are subject to massive revisions so we can’t reliably draw too many implications on numbers. Other than our own forecast assumption, for the annual net inflow to return to near 60k by year-end, now looks reasonable (having once looked heroic). If anything, it may prove to be a touch light.
Net migrant inflows have rapidly turned positive
We can get some sense of the sectors incoming migrants may be heading into by looking at Stats NZ’s breakdown of the long-term arrivals data by occupation. It is just a “sense” in that only around half of all arrivals are able to be categorised in this way.
From this, we can see that the largest numbers of long-term arrivals over the past 12 months, that we have visibility over, have been amongst schoolteachers, midwives and nurses, engineers, food trade workers, hospitality workers, bricklayers, carpenters & joiners, and construction & mining labourers. So, some encouraging signs given shortages in some of these areas.
Business surveys take the pressure down
But perhaps the clearest evidence that the turnaround in net migration flows is starting to soak up labour market pressure can be found in recent business surveys.
Most notably, Tuesday’s Q1 Quarterly Survey of Business Opinion (QSBO) revealed a clear easing in firms’ assessment of labour market, cost, and inflationary pressures. Not all of this will have been due to higher migration. We’re seeing more and more signs that domestic demand in NZ is starting to buckle in response to the Reserve Bank’s war on inflation. No more so than in the construction sector.
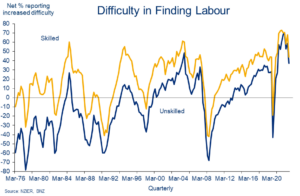
According to the QSBO, difficulty finding labour metrics shifted from levels akin to ‘impossible’ to just ‘hard’ (chart below), while firms’ pricing intentions are now consistent with annual inflation falling from the current 7.2% to closer to 6.0% over coming quarters.
Both are still miles too strong in an absolute sense, but at least the indicators are moving in the right direction. If they hadn’t, we would have been left nursing additional upside risk on our inflation and interest rate projections.
From impossible to just difficult
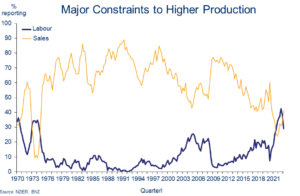
As an obvious indicator of labour market stretch, we had been making much of the fact that, for the past 18 months, firms had been reporting that labour is a bigger handbrake on their business than sales. The last time this occurred was the mid-1970s.
However, the QSBO confirmed that, as of the March quarter, things are at least starting to normalise. Sales are again a bigger constraint than labour for most firms (a net 41% for sales vs. a net 29% for labour).
It’s a sign that the economy is starting to shake off the supply-constrained status that has super-charged inflation and compelled the RBNZ to cool demand through ever-higher interest rates.
Rebalance underway
This rebalancing has further to run as the economic slowdown accelerates and demand comes under increasing pressure from mortgage rates resetting higher. But while further easing in capacity and labour market tightness can be anticipated, we remain of the view this process will be more akin to a slow leak than a sudden pop. The firm tone of recent hiring intentions and filled jobs data support the case. As a result, wage growth is likely to remain strong this year.
RBNZ goes its own waaaay
So while the direction of economic travel argues that the peak in interest rates is approaching, it also suggests it’s too soon for the Reserve Bank to take its foot off the interest rate brakes in the way its trans-Tasman counterpart did this week. The RBNZ will go its own way.
If there was any remaining doubt on this front, yesterday’s decision by the RBNZ’s Monetary Policy Committee to bump the official cash rate up another 0.5% to 5.25%, twice the 0.25% increase most had expected, will have blown it out of the water. We’ve nudged our OCR projections up in the aftermath, adding a final 0.25% lift in May (5.50% peak).
Still, rather than trying to push mortgage and business lending rates up a whole lot further, this was a decision seemingly intended to ensure they hold up around where they are, and don’t start to fall.
After all, wholesale interest rates have fallen materially in the wake of the offshore banking ructions. There was a risk lending rates could follow suit. The RBNZ’s shot across the bows was to ensure all of its work in getting lending rates up over the past 18 months doesn’t start to unravel prematurely.
This being the case, there are no implications for the views on mortgage rates and house prices we espoused in our new Property Pulse publication (sign up here). We were already suitably cautious about declaring short-term mortgage rates as having peaked, and house prices as having troughed. We remain of the view, though, that both are in sight.
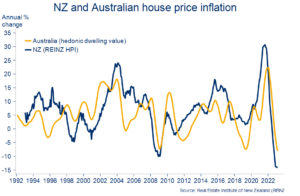
Since the above publication went to press, one development worth a quick mention was this week’s surprise 0.6% lift in Australian house prices in March. That’s the first increase in 11 months. Aussie house prices of course dance to their own beat, not least the more conducive interest rate backdrop in Australia.
We mention this only as there has historically been some degree of co-movement in antipodean house price cycles (chart below). We’ll be watching closely to see if Aussie house prices continue to rebound in coming months.
Loose links
To subscribe to Mike’s updates click here
_______________________________________________________________________________________________________________________________
Disclaimer: This publication has been produced by Bank of New Zealand (BNZ). This publication accurately reflects the personal views of the author about the subject matters discussed, and is based upon sources reasonably believed to be reliable and accurate. The views of the author do not necessarily reflect the views of BNZ. No part of the compensation of the author was, is, or will be, directly or indirectly, related to any specific recommendations or views expressed. The information in this publication is solely for information purposes and is not intended to be financial advice. If you need help, please contact BNZ or your financial adviser. Any statements as to past performance do not represent future performance, and no statements as to future matters are guaranteed to be accurate or reliable. To the maximum extent permissible by law, neither BNZ nor any person involved in this publication accepts any liability for any loss or damage whatsoever which may directly or indirectly result from any, opinion, information, representation or omission, whether negligent or otherwise, contained in this publication.