Eco-pulse: Upswing in rents has further to run
24 Jul 2023
- Rising population growth set against tight supply suggests the acceleration in rents has further to run
- Upside risks are particularly centred on those regions with very low or falling vacancy rates – like Auckland, Taranaki, and eastern parts of the North Island
- In time, affordability constraints will bite and we’ll see a firmer supply response. These factors should cap the extent of any increase
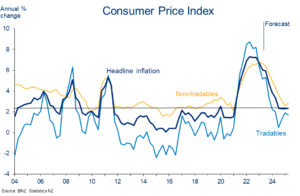
- Given rents have a high weight in the NZ Consumers Price Index, the upswing is one factor expected to slow the decline in CPI inflation this year and next
There’s been plenty of attention on the turning in the NZ house price cycle now underway.
But what about rents? After all, rented dwellings account for just over a third (36%) of the national housing stock. That makes the outlook for rents potentially just as important as that for interest rates when it comes to the cost of living. Rental price inflation also has an important influence on overall inflation, as measured by the Consumers Price Index (CPI). At around 10%, rents have a relatively high weighting in the CPI basket.
Below, we take a quick look at what’s been happening to rents around the country, relative affordability, and where things might head from here.
What’s been happening?
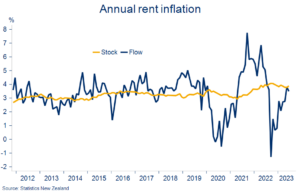
Along with just about everything else, rents have gone up a lot in the past couple of years. Following the COVID-related freeze on rent increases in 2020, annual rent inflation in the total stock of tenancies has rapidly climbed to around 4%.
This stock measure captures all tenancies and tends to be quite slow moving. Many rental agreements are long-term in nature, and tenants renewing existing leases are generally less likely to experience a change in rent than new tenants (this was recently confirmed, at least for Australia, in data recently published by the RBA).
We can also track flow measures that capture rents agreed at the time a tenancy commences. These more closely reflect current conditions in the rental market and hence are what we’ll focus on from here on out. These data do come with the proviso of being much more volatile, as can be seen opposite. This necessitates a bit of smoothing.
Weekly data on new tenancy rents, courtesy of MBIE, allow us to take a look around the regions (table below). National inflation in new rents is running at around 5½% y/y. But regional differences are stark. For example, rents in Wellington have fallen over the past year, while those in Southland and Taranaki have boomed at double-digit rates.
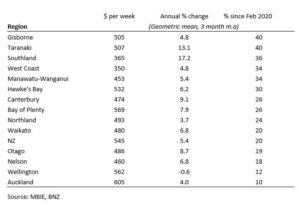
A comparison to pre-COVID levels (the benchmark du jour) serves to further highlight the regional divergence in NZ. The cumulative increase in average new rents over this roughly three-year period has varied from 10% in Auckland to 40% in Gisborne and Taranaki. In February 2020, average new rents in Taranaki were 34% below those in Auckland. Now, they are ‘just’ 16% lower.
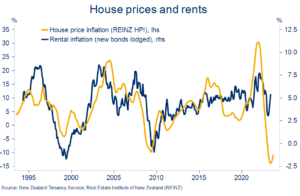
Interestingly, these regional ‘rankings’ for the past three years are very similar to those for house price performance. This is perhaps unsurprising given the expected close relationship between an asset and its yield, but it also reinforces how important varying supply and population dynamics have been in determining relativities in house prices and rents across NZ. In particular, the supposed closing of NZ’s housing shortage in recent years looks to have been a largely Auckland and Wellington story, with many regions elsewhere still short.
Are rising rents putting pressure on affordability?
We can get a high level sense of this by comparing rents to household incomes.
As can be seen from the chart, for NZ as a whole, the share of gross household income devoted to rent payments has remained fairly stable at around 25% in recent years. That’s quite close to the international average.
On the face of it, this might suggest household incomes have roughly kept pace with the rising rents. However, the ‘true’ picture for rent affordability is likely to be more challenging:
a) Those that make rent payments have a lower median household disposable income than those that own or partially own their home. About 20% less according to June 2022 figures from Stats NZ.
b) The median also hides large distributional differences. Around a quarter of (private) renters spend more than 40% of their disposable income on rents. That’s the second highest share in the OECD, behind the UK.
c) The latest available data used here is for June 2022, so this analysis won’t have captured the most recent spurt higher in rents.

Finally, while the NZ-wide rent-to-income ratio has remained steady, there’s been an interesting reshuffle amongst the regions.

As the chart shows, vacancy rates are not only relatively low, but they’ve fallen in most parts of the country over the past year as all the extra people in the country have soaked up available supply

Nowhere has this been more obvious than in Auckland – perhaps unsurprising given the city tends to be the first stop for inbound migrants. This time a year ago there was a relative abundance of rental listings (4.5% vacancy rate) and annual growth in rents was negligible. Over the subsequent 12 months, as population growth has surged, the vacancy rate has more than halved and new rents have lifted by around 4%.
While Auckland has experienced the largest fall in the rental vacancy rate, in absolute terms it’s still above the NZ average. Same goes for Wellington and Northland.
At the other end of the spectrum, rental markets in Taranaki and the eastern parts of the North Island – Gisborne, Hawke’s Bay, and Bay of Plenty remain extremely tight. Vacancy rates in these regions are close to or below 1% and have fallen over the past year. Amid a general upswing in rents, we might expect these regions – those that have the biggest supply deficit – to be most susceptible to strong increases in rents.
The outlook for supply obviously depends, in part, on investor activity. Election uncertainty is clearly having an impact in this regard as investors await the ultimate fate of mortgage interest deductibility.
Finally, will household income growth be sufficient to absorb rising rents? Our earlier affordability analysis showed that, at least at a national, aggregate level, rising rents appear to have been roughly matched by strong growth in incomes.
- Those renters that can cobble together a deposit may choose to exit the market and buy (we’ll address the “rent vs. buy” question at a later date). This includes those non-NZ citizens that become eligible to purchase a house, for example by having been a resident for 12 months.
- Higher rents would be expected to eventually generate a supply response. We’re not necessarily talking about a bunch of new construction, more the existing housing stock being used more intensively. Renting out a granny flat, spare bedroom, or bach becomes increasingly attractive the more rents and rental yields rise.
Implications