Eco-Pulse: Crosswinds
8 Aug 2023
- Labour market pressure release underway
- Joining the broader disinflationary creep
- As economic crosswinds remain consistent with stalling growth
- Enough for the RBNZ (and us) to hold the line on 5.50% OCR peak, despite pockets of inflation resistance
- Mortgage rate declines still a story for next year
- Housing market reawakening continues – are we undercooking our house price expectations?
Labour market from red hot to orange
Unusually, the message from last week’s slug of labour market data was relatively clear cut. Firms are still hiring workers with gusto, but this labour demand is now being ably met, and then some, by all the migration-fuelled labour supply we’re seeing. So it was that both employment (up a solid 1.0% q/q) and unemployment (up two tenths to 3.6%) rose from the previous quarter.
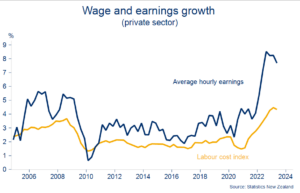
Wage growth peaking
Rather than hiring to meet existing or anticipated expansion, firms appear to be back-filling existing vacancies now there is the ability to do so. As this process runs its natural course, further increases in unemployment are likely as labour supply runs ahead of wobbling demand. Firms’ employment intentions remain consistent with a clear slowdown in hiring.
All of this will take some more of the heat out of wage growth, which the Q2 figures suggest might have already peaked (chart opposite).
Still, the overriding message is still one of a red-hot market transitioning to something more orangey in colouration. The ‘job-rich’ recession thematic remains broadly intact. We expect unemployment to rise to around 5% by the end of next year, and for wage inflation (according to the LCI index) to tail off to around 4%.
There were a couple of additional details in the data worthy of a mention. First, young people continue to enter the work force in increasing numbers.
NZ’s labour force participation rate (the share of the working age population in the labour force) hit another high of 72.4% in the June quarter. The largest increase was amongst 15–19-year-olds, continuing a trend that’s been in place since 2020 (chart below). Another side-effect of the cost-of-living pressures facing households? Or a reflection of the pull from strong labour market conditions and attractive pay?

Young people entering labour force in increasing numbers
The second thing that caught our eye was that, contrary to some suggestions, Auckland has not been at the centre of this year’s burst of migration-driven population growth. Yes, it’s recording the largest increase in numbers but, as the chart shows, in growth terms the region continues to lag.
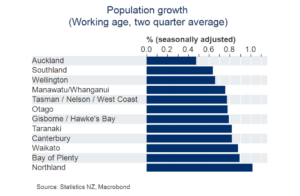
Auckland population growth still lagging
Disinflationary pulse percolating
As well as in the labour market, a broader disinflationary pulse continues to slowly percolate through the economy. This as demand remains out for the count and top-down indicators point to an economy likely to hold close to stall-speed for at least the remainder of this year.There have been some signs of life. The grinding recovery in business confidence and firms’ own activity expectations has now been up and running for seven months. The housing market is turning and there are, admittedly tentative, signs of an earlier-than-expected bottoming in residential construction activity (chart below).
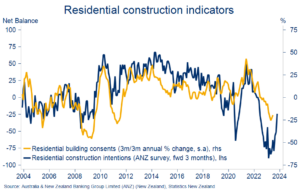
An early turn?
Providing some offset, though, has been a global economy still stuck in the mud, with the outlook for Chinese demand of particular concern. The negative implications for some of our primary exports are becoming more apparent. Having previously looked downright downbeat, our long-held below-consensus $7.60 Fonterra Milk Price forecast (hat tip to Doug Steel) suddenly looks optimistic. Indeed, Fonterra slashed its own payout forecast by a full $1.00 on Friday. The new midpoint is $7.00.
We continue to believe the current period of economic weakness will bring inflation to heel in time but it’s not going out without a fight. June quarter figures showed domestic (non-tradables) inflation remaining too high for comfort (6.6% y/y vs. 6.0% total) and we’ve also had to nudge up our inflation projections to allow for the latest spurt higher in petrol prices.
We now expect the annual rate of inflation to briefly tick up in the third quarter. This is still within the context of a strong downtrend, but it means we’ll be waiting until January (when Q4 figures are released) for confirmation headline inflation has fallen again. Plenty can happen in the meantime.
It’ll be a nervous wait for the Reserve Bank. But we continue to believe waiting is the right approach. And at a time when the inflation outlook was starting to grate (even more), confirmation the labour market is now easing will provide some comfort.

Blip in the downtrend
Reserve Bank on hold message to be reheated
We thus don’t expect any big changes in tone or projections when the Reserve Bank meets next week. A long period of time with the OCR being held at 5.50% still looks the most likely outcome to us. That message should get a reheat on 16 August.
Our official forecasts continue to peg May 2024 as the likely timing of the first cash rate cut. We’re still not in a position where additional hikes, as some are still projecting, can be completely ruled out. But, in our opinion, the more likely –and effectual – response from the Bank should inflation prove persistent would be to keep the OCR at current restrictive levels for longer.
Against this backdrop, we continue to caution against expecting mortgage and more general interest rates to start dropping away this year.
Signs of life in housing market
Despite the tick higher in mortgage rates, the recent run of play remains consistent with our view the house price cycle has moved out of a correction phase and into a tentative upswing.
Indeed, seasonally adjusting the monthly REINZ House Price Index shows house prices stopped falling in March, were flat over the subsequent two months, and perked up in June – the first gain of any note since the market peaked in November 2021.

House price green shoots
Yes, seasonally adjusting house price data might be a tad academic – no one transacts at a seasonally adjusted price after all. But it does allow a cleaner view of the creeping change in the monthly figures. Broader indicators and sentiment also appear to be turning in a way that supports our view the upshift will be sustained.
Sales activity has now been trending higher for the past six months. RBNZ lending figures suggest first home buyers have been the most active cohort in this. Notably, the pop in sales, against a dearth of new listings, is seeing some markets tighten up already. For example, the ratio of house sales to new listings in Auckland is now pushing towards 70%. That’s above the long-run average and, on past form, indicative of house price momentum continuing to build (chart below).

Auckland market tightens up
We’re left wondering if we might be undercooking things a touch with our assumption of a 2-3% lift in house prices over the second half of this year. For now, we’re content to sit tight and nurse the upside risk. This thanks to a couple of factors that may check the pace of the upturn in coming months:
- First, the supply of listings should start to pick up from here if market conditions really are improving. The chart shows that listings normally would have followed sales activity higher by now (the so-called “encouraged seller” effect), but this hasn’t happened. It may be that vendors are waiting to see what the election brings.
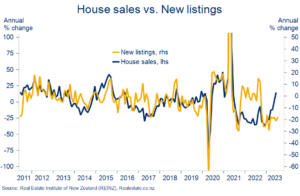
New listings still very low
- Second, mortgage rates have nudged a little higher. They’re already at levels that are restraining activity and the outlook, if anything, is currently tilting higher for longer. Still, this is more something to slow the recovery than snuff it out altogether. We still think the cycle peak for mortgage rates is close to hand.
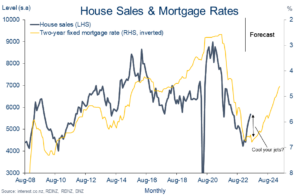
Curbing your enthusiasm
We’ll assess how these factors pan out over the next few months to see if an upgrade to our short-term outlook is warranted. Our forecast assumption for next year, of a 7% annual lift in house prices, still feels about right once the usual house price forecasting caveats are applied (basically, beware!).
To subscribe to Mike’s updates click here
| Disclaimer: This publication has been produced by Bank of New Zealand (BNZ). This publication accurately reflects the personal views of the author about the subject matters discussed, and is based upon sources reasonably believed to be reliable and accurate. The views of the author do not necessarily reflect the views of BNZ. No part of the compensation of the author was, is, or will be, directly or indirectly, related to any specific recommendations or views expressed. The information in this publication is solely for information purposes and is not intended to be financial advice. If you need help, please contact BNZ or your financial adviser. This publication is intended only for the person in New Zealand to whom it is sent by BNZ, and must be treated as strictly confidential. Any statements as to past performance do not represent future performance, and no statements as to future matters are guaranteed to be accurate or reliable. To the maximum extent permissible by law, neither BNZ nor any person involved in this publication accepts any liability for any loss or damage whatsoever which may directly or indirectly result from any, opinion, information, representation or omission, whether negligent or otherwise, contained in this publication. |


