Too much of a good thing? Looking into housing supply
22 May 2025- National housing market overall appears more balanced than oversupplied
- Still, rising levels of unsold inventory are a feature of all regions, and particularly Wellington & Auckland
- A relative abundance of townhouses notable in Auckland and Canterbury
- All tends to support a multispeed house price response to falling interest rates
It’s clear enough to anyone with a passing interest in NZ’s property market that there’s plenty of supply about. That’s both in the real-estate market and, perhaps even more so, the rental market.
But can we say anything about where it is most obvious? We tend to focus on indicators at a national level, but a cursory glance at recent house price changes hints at a varied mix of conditions around the regions.
The south heads north

The top down view
Starting at the national level, unsold inventory in the real estate market is up around 10-year highs. That’s not to say it’s markedly high in absolute terms – it’s actually bang on the long-run average. It’s more that inventory was particularly low over the 2016-2022 period, and those tight market conditions have now unwound.
Whatever the nuance, prospective buyers clearly have much more time and choice than they have for some time. And the important bit is that there’s been no reduction in this elevated level of inventory even as housing demand has climbed back to near normal levels in the wake of cuts to mortgage rates.
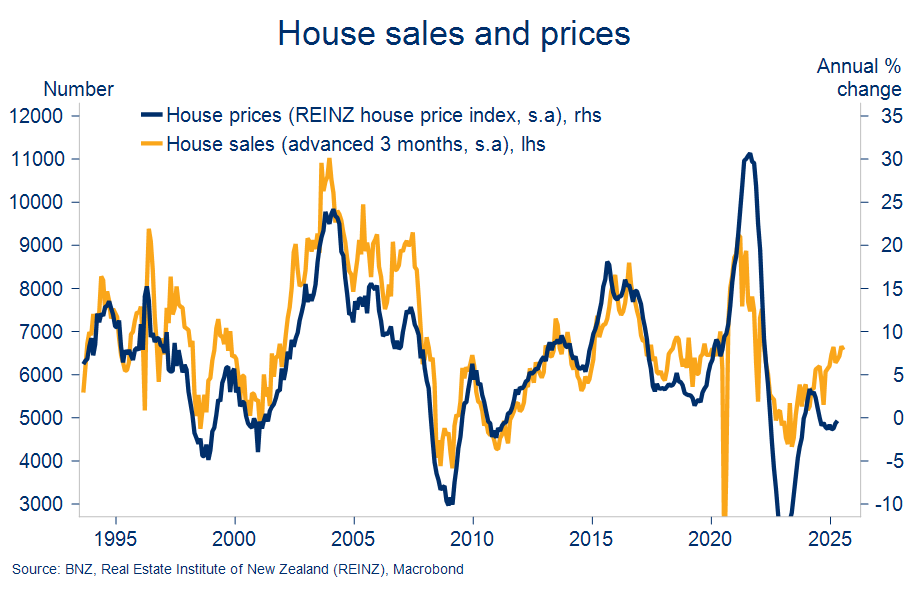
Historically, a lift in buying activity like we’re seeing now would be associated with a tightening housing market and accelerating house price inflation, as depicted in the chart below. It hasn’t been so this time. Listings have at least kept pace with sales, leaving the market closer to a state of broad balance. Outside of parts of the South Island, there’s been scant pressure on house prices to rise.
House sales and prices diverge
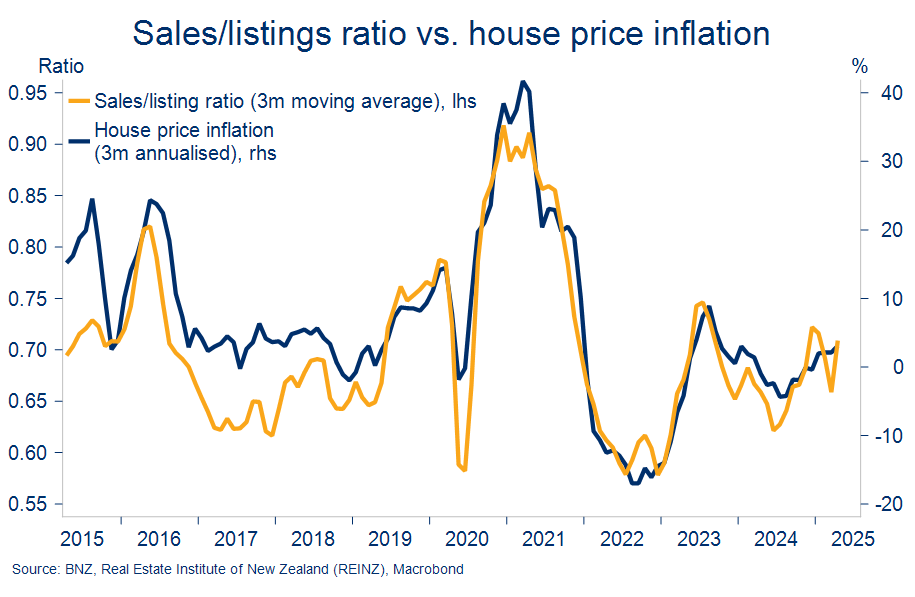
Indicators of housing market balance that better capture these supply dynamics – like days to sell a house and the sales-to-listings ratio – remain consistent with a slow growth environment for national house prices. That said, a firming trend is starting to become more evident in both.
Broadly balanced?
More supply in Wellington, Auckland
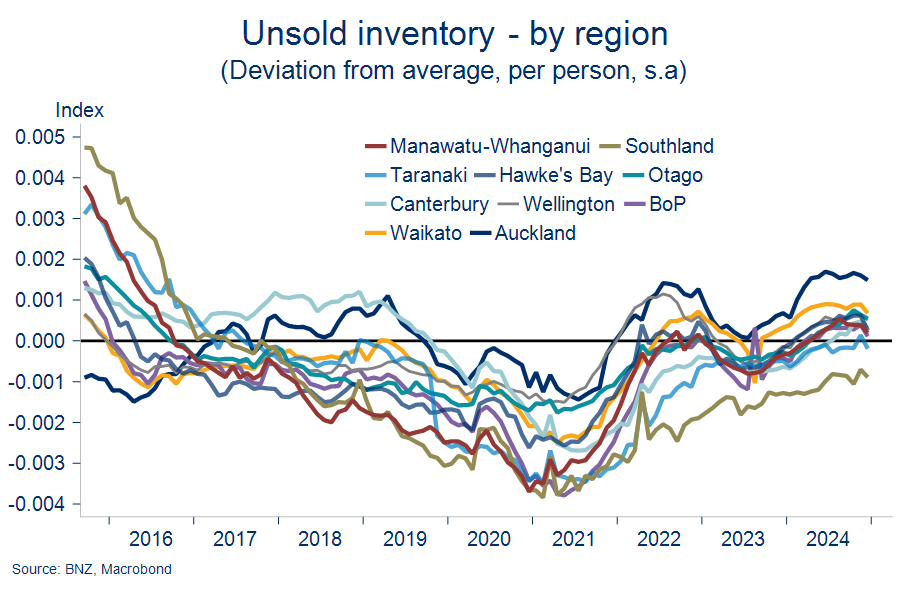
To get a sense of how this overall picture is distributed around the regions, we compare unsold inventory levels (seasonally and population-adjusted) to the average. Regional data can suffer from volatility and small sample issues, so we also had a look at stock-to-sales ratios as a cross-check on differences in available housing supply. The values that drop out of these calculations are not so interesting, as are their general direction and relativities.
In both cases, those regions occupying the relatively looser (more inventory) end of the spectrum are Auckland, Waikato, Wellington and, surprisingly, Otago. Those regions consistently appearing at the tighter (less inventory) end include Southland, Bay of Plenty, and Hawke’s Bay.
Auckland on top
The lay of the land in the rental market is similar.
Total available rental listings on Trademe are 31% higher than May last year which, in turn, were 41% higher than May of 2023. Every region has experienced at least a double-digit increase in rental listings this year.
Rental listings can of course rise because the overall size of the rental market is growing. So it’s useful to compare rental vacancy rates across regions– the number of available rental listings as a share of total tenancies.
Our estimates of such are below. It’s worth looking at both the rate itself but also how it has changed, as some regional rental markets seem to operate at consistently higher/lower vacancy rates than others.
Rental vacancy rates soar

Wellington and Auckland again come in at the top (higher vacancy rate) end, both in an absolute sense and in recording some of the largest increases of the past two years. Unsurprisingly, rental price inflation in these two regions has been the lowest of anywhere and is now negative on an annual basis (for new tenancies).
Northland, Canterbury, and Manawatu are also in the top half, albeit Northland doesn’t appear much looser than recent years. Towards the tighter end are Gisborne (albeit with the second largest increase from last year), Taranaki, Waikato, and the Bay of Plenty and Hawke’s Bay.
Townhouses plentiful in Auckland, Canterbury
Next, is it possible to say what type of property might be responsible for heightened inventory levels? The anecdote points towards a glut of new builds and townhouses in the Auckland and Christchurch markets in particular.
It’s difficult to be too definitive here given we don’t have a time series of the relevant data. But it is possible to find some evidence supporting the anecdote in the data we do have. The share of property listings for sale that are townhouses in both Canterbury and Auckland is between 10-15%. The average across all regions is 4%. The bigger cities would be expected to feature a higher share of townhouses, but this nevertheless appears elevated.
Meanwhile in the rental market, just under a quarter of all listings in Canterbury are townhouses. For Christchurch city the share is 28%. That compares to 15% for Auckland (11% for Auckland city) and an 8% average across all regions.
Townhouses a feature of Auckland, Canterbury inventories

New builds comprise 25% of Auckland listings and 20% of those in Canterbury, noticeably higher than elsewhere. This reflects the coming to market of the huge pipeline of construction work of the past five years (chart next page).
Building boom cools

Building consents for townhouses have tailed off over the past couple of years but the townhouse share of consenting numbers in Auckland and Canterbury remains elevated: 37% in Canterbury and 54% in Auckland.
Implications?
So, pulling all this together, we note:
- At a national level, while unsold inventory is at 10-year highs, the housing market appears closer to a balanced state than overtly oversupplied. We expect some of this heightened inventory to be worked off as housing demand continues to lift. But it also seems likely that some rental inventory will be listed for sale as conditions in the housing market warm up, slowing this process.
- Rising levels of inventory are a feature of all regions, but Wellington and Auckland stand out as being the most well supplied. That’s across both the real estate market and particularly the rental market.
- While conditions in Wellington are weak for obvious reasons, a relative abundance of new builds and townhouses appears to be a feature of heightened inventory in the Auckland and Canterbury markets.
- The Bay of Plenty and Hawke’s Bay property markets appear tighter (relatively less supply) than most.
All of this tends to support the idea of a multispeed property market response to falling interest rates and the general improvement in economic conditions underway.
All else being equal, relatively higher inventories in the townhouse market and the housing markets of Auckland and Wellington may supress or slow those regions’ participation in the modest bump in house prices we’re expecting this year.
To subscribe to Mike’s updates click here
Disclaimer: This publication has been produced by Bank of New Zealand (BNZ). This publication accurately reflects the personal views of the author about the subject matters discussed, and is based upon sources reasonably believed to be reliable and accurate. The views of the author do not necessarily reflect the views of BNZ. No part of the compensation of the author was, is, or will be, directly or indirectly, related to any specific recommendations or views expressed. The information in this publication is solely for information purposes and is not intended to be financial advice. If you need help, please contact BNZ or your financial adviser. Any statements as to past performance do not represent future performance, and no statements as to future matters are guaranteed to be accurate or reliable. To the maximum extent permissible by law, neither BNZ nor any person involved in this publication accepts any liability for any loss or damage whatsoever which may directly or indirectly result from any, opinion, information, representation or omission, whether negligent or otherwise, contained in this publication.