Eco-Pulse: West is best? How we stack up against Australia
19 Apr 2024
- We run a quick stock take on the NZ and Aussie economies
- Australia comes out on top
- A more rapid slackening in NZ’s labour market stands out as one of the more important differences
- It’s likely to impact relative trends in house prices and spending, and lead to additional NZ migration outflows
We’ve kicked the tyres on the perception NZ’s economy is in a parlous state compared to Australia. We take a quick tour of relative trends in GDP, housing markets, labour markets, trade, the fiscal situation, and the outlooks for inflation and interest rates.
We find the cyclical positions of the two countries are not that different. It’s just that Australia’s economy is in an outright stronger position in nearly all areas. Much as it pains us to admit, it’s a comparison more akin to recent trans-Tasman cricketing match ups than it is to NZ’s dominance in rugby.
A couple of implications spring to mind. First, the pace of net NZ migration outflows to Australia seems likely to pick up further before the cycle is over (chart below). Second, we may see further depreciation in the NZ dollar exchange rate against the Aussie dollar. The latter has been baked into our forecasts for a while.
Westward bound

On interest rates, NZ’s relative underperformance doesn’t necessarily mean the Reserve Bank of NZ (RBNZ) will beat the Reserve Bank of Australia (RBA) to the punch on cash rate cuts. Indeed, our forecasts have the cutting cycle for both starting in November. Still, if one of the antipodean central banks was to get cracking earlier, we can’t help but think NZ would be the more likely candidate.
Overall activity
NZ’s economy is in recession. Economic output (GDP) has contracted in four out of the last five quarters. Annual growth is currently -0.3%y/y, or a particularly nasty -3.1% y/y in per-capita terms.
If NZ’s economy hit a wall in late 2022, in Australia it’s been more of a cushion. Annual economic growth there has cooled to +1.5%, or -1.0% in per-capita terms. In both countries, the residential construction, manufacturing, and retail sectors stand out as weak spots.
Our forecasts[1]have both economies rounding the bottom of the business cycle around the middle of this year, albeit with NZ stooping to a lower bottom. Prospects for some interest rate and inflation relief over the second half will be key in shaping the upturns in both countries.
GDP gap maintained

Housing
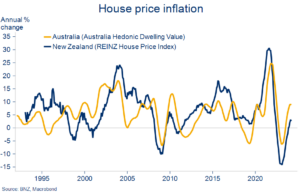
Antipodean housing cycles tend to move roughly in sync. There’s generally a touch more ‘boom/bust’ about NZ house price cycles though, particularly the most recent one (chart below).
While NZ house prices rose by more during the 2020/21 boom, Aussie prices didn’t experience the same amount of bust on the other side. They’re also now rising again more obviously (+9%y/y in March vs. +2.6% y/y in NZ). Indeed, Australian house prices recently reclaimed the 2022 record highs. By contrast, NZ prices remain about 14% below the (2021) record. They’re also unlikely to get back up there anytime soon on our reckoning.
A bit more “up” to the Aussie upswing
The difference is not just about interest rates.
Yes, the RBNZ lifted the cash rate by more than the RBA. But the increase in the average mortgage rate being paid has been broadly similar in both countries (chart below). This thanks to Australia’s preponderance of floating rate mortgages and hence more rapid pass through of cash rate hikes.
Additional factors explaining NZ’s relatively cooler housing market include a larger strain on affordability[2], and weaker servicing metrics, in part thanks to a softer labour market.
Similar amount of mortgage tightening in NZ & AU

We see house price inflation of about 5% in both NZ and Australia over calendar 2024. Both countries are underbuilding at a time of record population growth, and both are grappling with rent inflation in the high single digits.[3]
Labour market
Labour market conditions are deteriorating in both NZ and Australia. Both have experienced a large migration-inspired increase in labour supply. And neither economy is generating enough jobs for all these extra workers. Thus, unemployment rates have started to rise.
Population/migration booms in both countries

What is clear though, is that NZ labour market conditions are coming off the boil a lot faster. NZ experienced not only a proportionately larger migration boom (chart above) but the boom was mostly in work visas. By contrast, Australia’s was much more concentrated in student visas. NZ’s weaker demand backdrop also means NZ firms have been quicker to curtail labour requirements.
Consequently, firms now report it is much easier to find labour in NZ than it is in Australia (chart below). We expect a larger increase in unemployment in NZ (to 5.5% this year from 4.0%) than Australia (to 4.5% from 3.7%). This is likely to bring about bigger declines in labour turnover, job security, and wage growth on this side of the ditch.
Labour less of a limiting factor in NZ

The relative underperformance of NZ’s labour market stands out as one of the major differentiators between the two economies this year. It will make its presence felt in relative trends in house and rental prices, retail spending, and, potentially, inflation and interest rates. And, as our first chart intimates, the pull from additional job opportunities across the Tasman is likely to underscore further NZ-AU migration outflows this year.
Trade and the twin deficits
A good chunk of Australia’s comparative economic strength is sourced from more favourable external trade conditions.
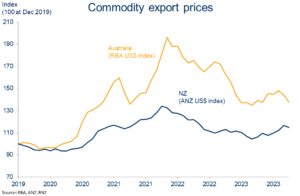
Prices for Australia’s key goods exports (iron ore, coal, and LNG make up just over 70% of the total) have held up better than NZ equivalents (dairy, meat, and forestry). In turn, that has imposed less of an income adjustment across the Tasman.
Hard commodity prices outperform
A strong Aussie export performance, NZ’s greater inclination to binge on imports through 2021/22 (itself reflecting an overheated economy), and the fact that NZ felt the COVID-era loss of international tourism more acutely have all contributed to a stark divergence in our trade and current account balances over recent years.
Hmm
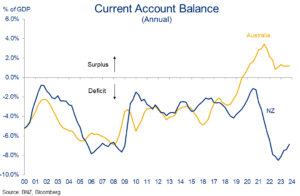
NZ’s current deficit has at least stopped getting worse but remains at an eyebrow raising 6.9% of GDP. Australia is running a rare (until recently) current account surplus of just over 1% of GDP. It’s a bracing departure from the similar balance of payments trends prior to 2019.
This pattern of divergence is, perhaps unsurprisingly, mirrored in the fiscal accounts. The broadly similar cycles prevailing since 2000 parted ways abruptly in 2021/22. Australia recorded its first underlying cash surplus in 15 years in the fiscal year just gone (2022/23) and may well notch up another this year.
That’s even as NZ’s equivalent deficit remains around 6% of GDP with any return to surplus likely many years away. A stronger Aussie labour market, robust resource sector incomes, and a sharp pull back in Australia government expenses through 2022/23 are all contributing factors to the divergence.
Government (net) debt in both countries is relatively low but, relative to Australia, NZ’s twin deficits will clearly constrain our fiscal options and broader growth potential over the next few years.
Inflation and interest rates
Despite some hefty macro differences, the antipodean outlooks for inflation and interest rates – at first blush – are eerily similar.
Disinflation in both countries has brought annual CPI inflation about half-way back to target from the 2022 peaks (Australia 4.1% as at Q4, NZ 4.0% as at Q1). BNZ/NAB forecasts have this progress continuing such that inflation returns to the top end of RBA/RBNZ target ranges in the second half of this year.
This, alongside sub-par economic growth, is expected to provide the antipodean central banks with enough breathing room to lower interest rates. BNZ Economics formally forecasts November as the first cut, with NAB Economics forecasting the same for the RBA.
Battle half won

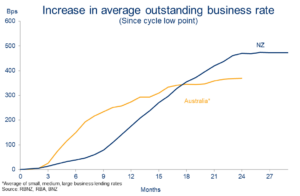
So far, so similar. The thing to remember though, is that the NZ economy has had to sacrifice more to get here. Interest rates are higher (further above ‘neutral’) and economic activity is weaker. And while the mortgage belt has been hit with a similar amount of tightening in both countries, NZ business borrowers, with their higher degree of floating rate exposures, have had to shoulder more of a burden (chart below).
NZ businesses shoulder rate hike burden
It’s taking a toll. The past couple of weeks’ worth of NZ economic data points to an economy increasingly buckling under the weight of these higher rates. Some of the green shoots are withering. Thus, while our rate cut forecasts are currently roughly aligned, if one of the antipodean central banks was to get cracking earlier, we can’t help but think NZ would be the more likely.
We can add this risk onto the pile of others (commodity price, fiscal, labour market) that all suggest the NZ dollar may yet depreciate further against the Aussie this year.
[1] All forecasts for Australia courtesy of our colleagues at National Australia Bank.
[2] See for example Demographia’s latest relative affordability report here
[3] We’re referencing annual inflation in new tenancy rents in NZ’s case, not the stock measure.
To subscribe to Mike’s updates click here
| Disclaimer: This publication has been produced by Bank of New Zealand (BNZ). This publication accurately reflects the personal views of the author about the subject matters discussed, and is based upon sources reasonably believed to be reliable and accurate. The views of the author do not necessarily reflect the views of BNZ. No part of the compensation of the author was, is, or will be, directly or indirectly, related to any specific recommendations or views expressed. The information in this publication is solely for information purposes and is not intended to be financial advice. If you need help, please contact BNZ or your financial adviser. Any statements as to past performance do not represent future performance, and no statements as to future matters are guaranteed to be accurate or reliable. To the maximum extent permissible by law, neither BNZ nor any person involved in this publication accepts any liability for any loss or damage whatsoever which may directly or indirectly result from any, opinion, information, representation or omission, whether negligent or otherwise, contained in this publication. |