Stuck in second
24 Jun 2025- Concerns about wobbly economic demand reappear
- Stirring these into the mix with already heightened housing supply suggests the slow pace of house price gains will continue
- We tab down our forecasts accordingly
- Value in the mortgage fixing decision still tilted more toward longer terms in our view
Welcome to the June quarter Property Pulse. Supporting our more regular Eco Pulse updates, the aim here is to chat through recent housing and mortgage rate happenings, and provide our take on the outlook.
Included in report:
- The view, in brief
- House price outlook
- Mortgage rate outlook
- Appendix: Regional Heatmap
BNZ house price forecasts
Impact of macro drivers on our house price view
The table below summarises the various drivers of house price inflation and their directional impact on our view.

Where are we at?
Lower mortgage rates are continuing to thaw out the housing market. As we’re seeing in other areas of the economy though, it’s a recovery that’s creaky and tentative. And the latest (May) set of housing data provided few signs of momentum picking up.
Still, to say the overall market is ‘flat’, is an oversimplification. There is clearly evidence of an interest rate-related boost in the increased number of property transactions taking place, and the associated jump in lending to the sector.
The pace of house sales is continuing to trend higher. At about 6800/month (seasonally adjusted), national house sales are now 15% ahead of levels this time last year. They’re now more or less bang on the long-run average. Transactions in some regions, like Waikato and Canterbury, are well above average (10% and 30% above, respectively).
Importantly, it looks as if mortgage rates have fallen to a level that is finally stirring more interest amongst the heavyweight owner-occupier segment of the market (60% of new lending). Investors remain active too, while first-home buyers have retreated a touch. The latter now account for 20% of new lending, down from the 25% peak.
Interest amongst owner-occupiers stirs

Housing supply – too much of a good thing
The extra turnover is not producing the sort of upward jolt to house prices that we might have seen in the past. Prices are rising but they’re doing so at a glacial pace.
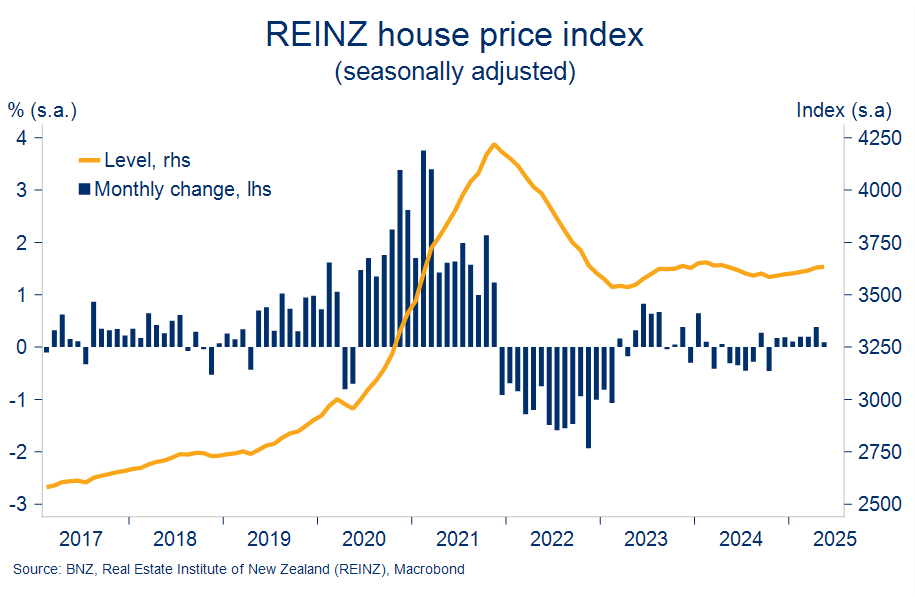
The REINZ house price index registered a 0.1% (seasonally adjusted) increase in May. That was the 7th consecutive (s.a.) monthly gain. But the cumulative gain over that 7-month period amounts to just 1.4%. Annualised, that’s house price inflation running just north of 2%.
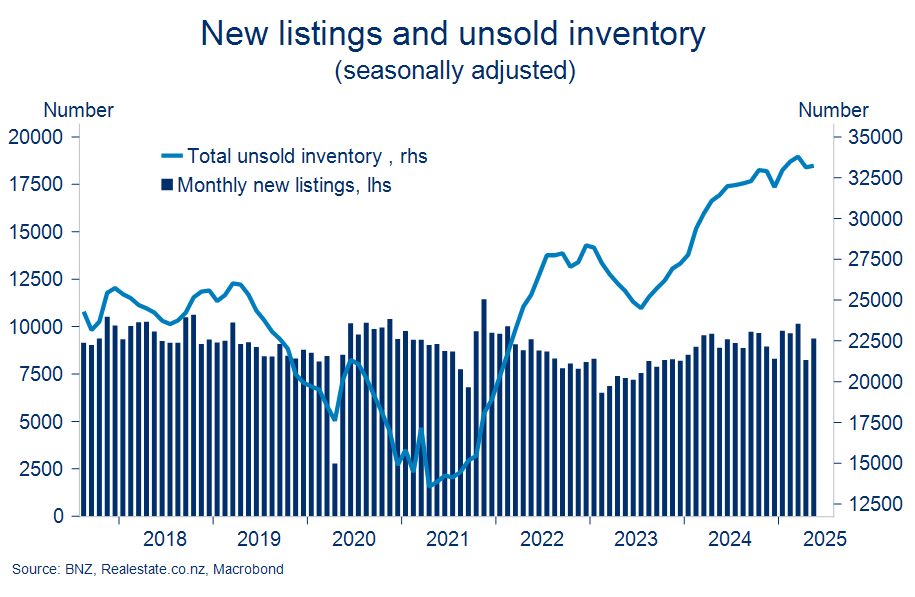
The now well understood reason for the subdued price response is the fact there’s plenty of supply about. Unsold inventory remains around 10-year highs. Buyers have both more time and more choice. Recent local council property (de)valuations in Wellington and now Auckland just reinforce this tilt in the balance of market power.
Steady
We’ve regularly flagged the price suppressing implications of the supply response (see for example here and most recently here). To reiterate a couple of the conclusions from the latter note:
- The process of working off high inventory levels may be slowed by some of the excess inventory in the rental market ultimately being listed for sale as conditions improve;
- Supply relativities are likely to produce a multi-speed property market response to lower interest rates. The relatively higher inventories in the townhouse market, in Auckland, and Wellington, suggests those markets may underperform the broader upturn.
Recent inventory data from realestate.co.nz does hint at the supply wave starting to stabilise. The pace of new listings has flattened off in the past few months meaning overall inventory levels have held steady rather than push higher.
Past peak supply?
Demand wobbles
The big question confronting housing market forecasters is how long this heightened inventory might take to work through. We suspect it might take little longer than many are expecting now that, as flagged in some of our other publications, we’re seeing some wobbles in the demand-side of the economy.
- High frequency data point to a concerning sag in demand through the middle part of the year. Some of this might be temporary owing to the April and May gyrations in US tariff policy. But at least part of it is expected to stick around. We’ve downgraded our growth forecasts to just 0.8% for this calendar year (annual average GDP growth).
- Weak labour market conditions drag on. Positive employment intentions have not yet been reflected in actual hiring – job ads are still crawling along 11-year lows. Surplus labour supply is being reflected in falling participation, slowing wage growth, and elevated job insecurity.
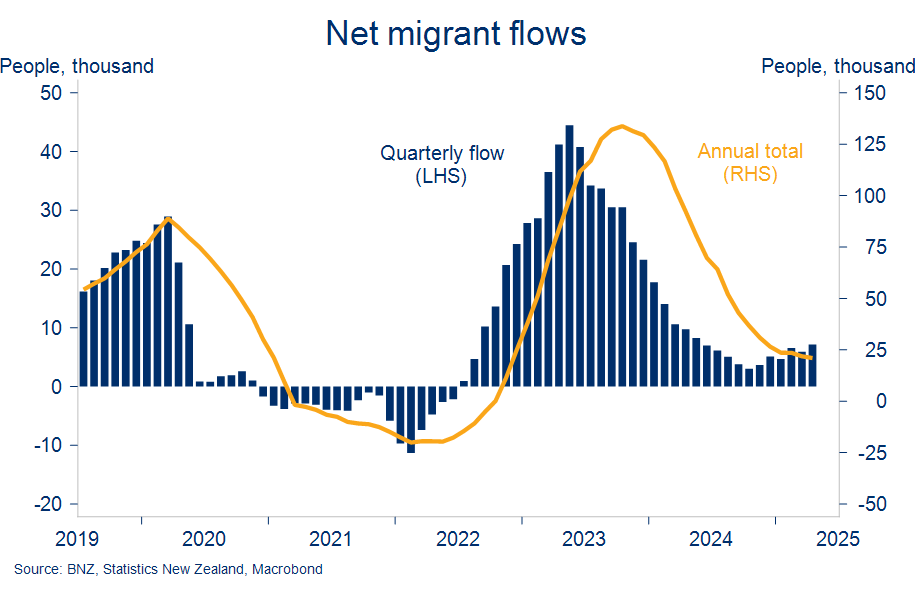
- Net migration has proved to be slow in turning meaning population growth is likely to remain sub-par (<1%) this year. There’s been a tendency for Stats NZ to revise down initially firmer-looking net migration estimates. Net inflows have thus continued to shuffle along at annualised pace of about 20k.
We think these weights on housing demand will continue to lean against the strong support coming through from
Migration crawling along the bottom
falling mortgage rates. And combined with our existing concerns about heightened supply, the shakier demand backdrop has us forecasting a continuation of the current slow pace of house price gains.
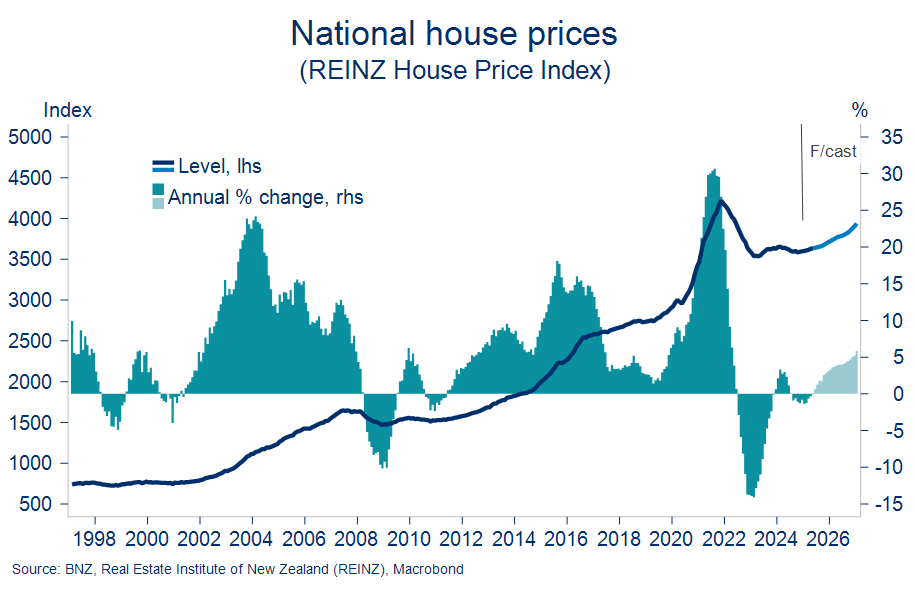
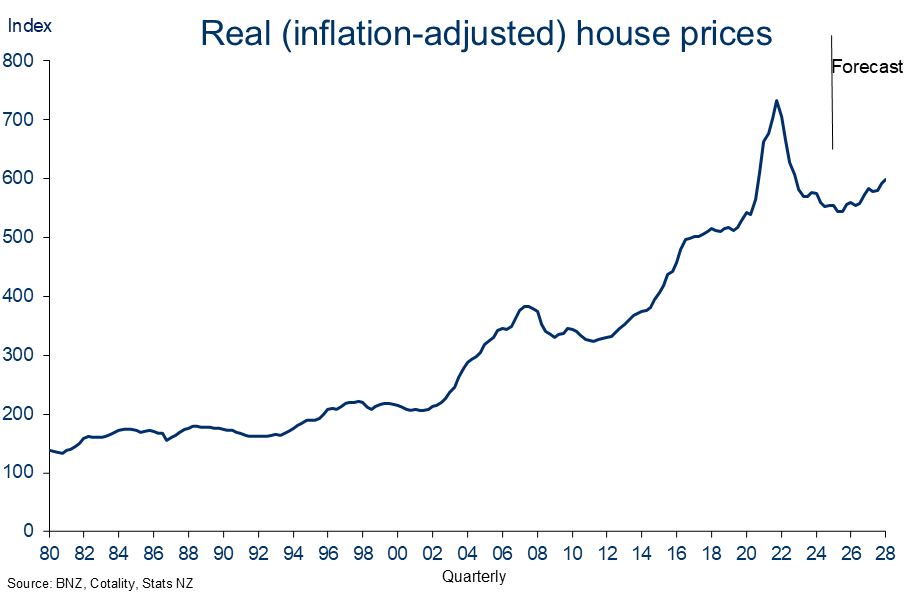
Ongoing small monthly gains tote to an annual lift of 2-4% for 2025. We continue to assume a marginal pick-up to 5% annual house price inflation through calendar 2026.
If all of this proves close to the truth, always a big ‘if’ given the vagaries of house price forecasting, inflation-adjusted house prices would end this year around the same level as mid-2020, 24% below the 2021 peaks. It highlights the reduced role for housing and the associated ‘wealth effect’ in this economic recovery.
Our assessment is that the risks around these forecasts are roughly balanced, at least as far as the ‘known unknowns’ go. As we have seen, ‘unknown unknowns’ continue to come through thick and fast.
Back to mid-2020 levels
Mortgage rate outlook
Our view at a glance*
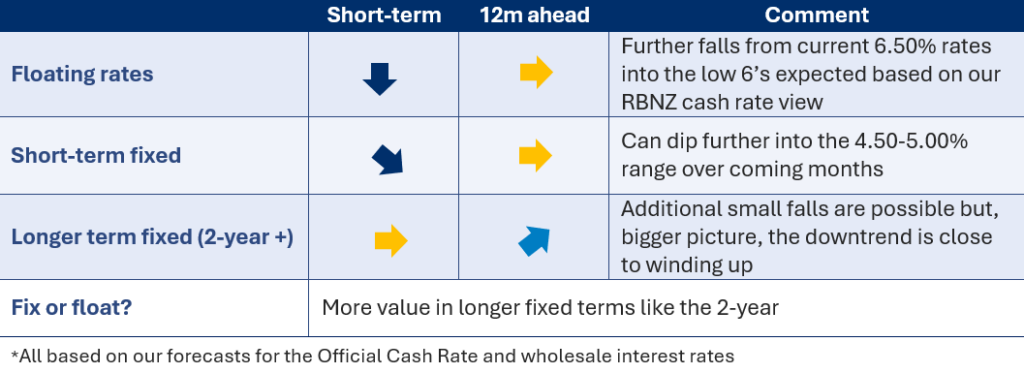
Floating rates – home stretch
Further falls in floating mortgage rates are likely based on our forecasts for additional cash rate cuts from the Reserve Bank. It should be noted though that, with the end of the easing cycle coming into view, the extent of these expected falls is now more limited.
A total of 225bps of cash rate cuts have been delivered to date. There’s debate about how many more cuts the RBNZ will deliver given heightened global uncertainty and inflationary embers that refuse to die off. The Bank may choose to pause the easing cycle in July to buy more time to assess these developments.
Our (unchanged) forecast is still for two further 25bps cash rate cuts in July and August, delivering a 2.75% low point in the cash rate cycle. Market consensus is closer to a 3.00% end-point. Putting it all together, our best guess is that carded floating rates bottom out in the low 6’s in coming months.
No change to BNZ OCR forecasts

Fixed rates – falls in shorter terms
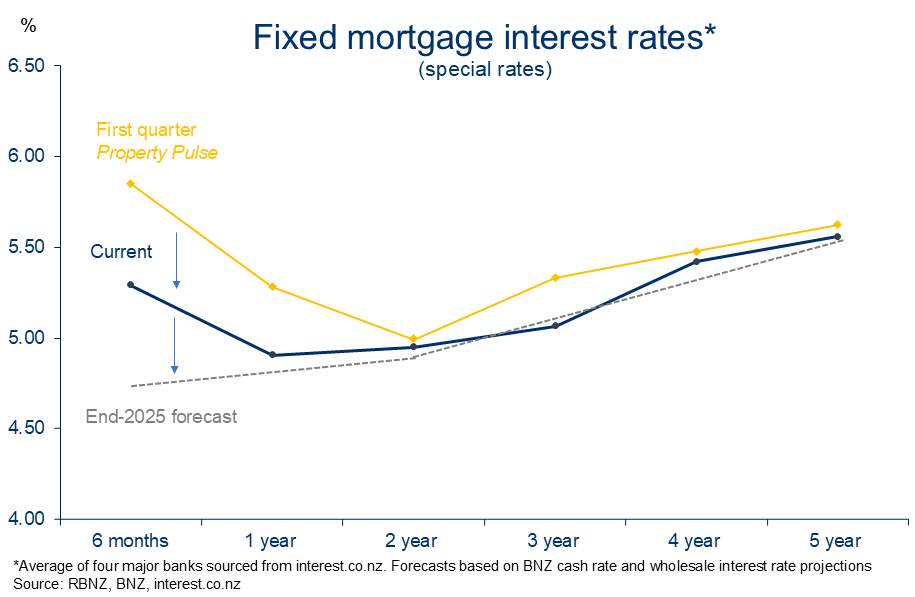
Fixed mortgage rates have continued to ease since our last report. As expected, these falls have been concentrated at terms of less than two years. Indeed, the two-year rate of just under 5% remains the key pivot point for the mortgage curve (chart below).
Pivoting around the 2-year term
More of the same is expected. The final stages of the Reserve Bank’s easing cycle are baked into most term mortgage rates already. There’s still room for tinkering here and there should the offshore picture or local data flow spring any surprises. Downside risks predominate in this regard.
But our core view remains unchanged in that it’s just short-end mortgage rates that can be expected to fall meaningfully from here. Our forecasts have six-month and one-year fixed mortgage rates easing further into a 4.50-5.00% range by the end of the year.
Absent a new shock turning up, there’s limited potential for declines in longer-term rates. It’s essentially the final stages of adjustment back to a more ‘normal’ upward-sloping mortgage curve (see ‘forecast’ line above).
Mortgage strategy
Before diving into the rate fixing debate, it’s worth reiterating that getting a mortgage strategy “right” is primarily about meeting a borrower’s financial needs and requirements for certainty. Trying to pick the timing of interest rate movements is fraught with difficulty.
Given where we are in the interest rate cycle, the broad nature of the fixing decision facing the average borrower could be framed as either:
- terming out some borrowings now at a rate near 5% (for any of 1, 2, or 3 years); or
- holding out a little longer by fixing for six months a few more times.
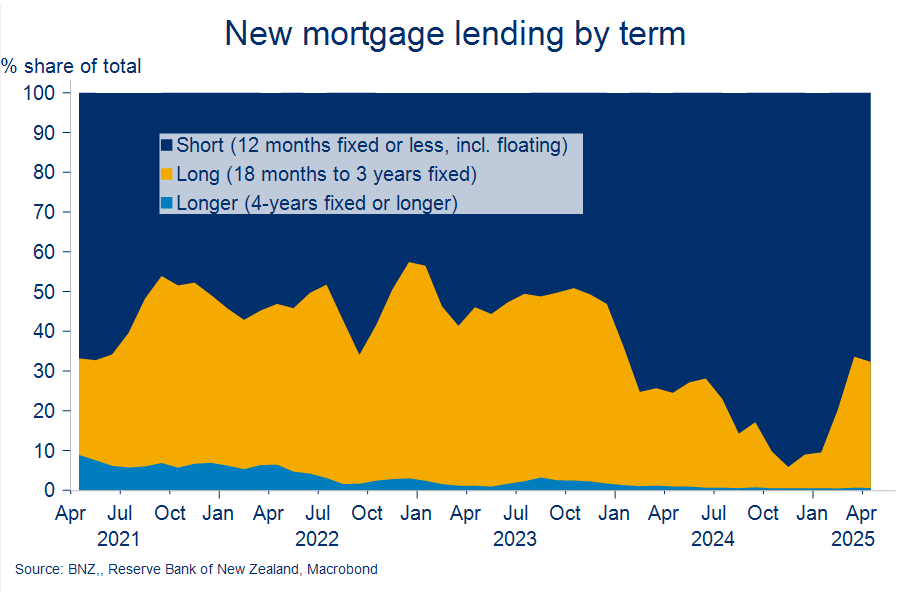
Of course, there’s also the option to just ‘float through the cycle’ and stick to floating and six-month terms. But the two options above seem to be where the calculus is at for most mortgage borrowers. There is almost no appetite to fix for four years or longer (see chart below).
What have people been doing? “Peak short” was hit in November when 94% of all new mortgage borrowings were fixed for terms of a year or less. As of April, that had reduced to 68% as longer fixed terms gained in popularity. That fits with the message we’ve been running since the start of the year that there may be a less favourable risk/reward in shorter-term mortgage fixes. We maintain that view.
Moving on from “peak short”
Fixing for a short-term like six-months has the advantage of providing the optionality to get a longer-term fix at lower term rates than currently, should they transpire. And a few extra bps off can make a lot of difference to cash flow over a two- or three-year loan period.
The rub is that 6-month fixed rates are 30-40bps higher than one-to-three-year fixed rates. Term mortgage rates thus need to be lower when you go to refix just to recoup this extra upfront cost. Breakeven analysis can provide a sense of how much lower.
Suppose you are tossing up between a) fixing for six-months ahead of locking in for longer, or b) just locking in now for either one or two years. If you fix for six months at 5.30%[1], to break-even you need the one-year rate to fall from 4.95% now to 4.70% by the time you go to fix in six months’ time. The break-even equivalent for the two-year mortgage rate is a fall from the current 4.95% to 4.90%.
Both of these scenarios are entirely plausible, and in a world of heightened risk – most of it negative – a short-term fix has the advantage of full optionality to the downside. But to reiterate the obvious, those are break-evens, so you need slightly larger falls to be better off.
For many borrowers, the potential payoff involved in going short, giving where we are in the interest rate cycle, may not be worth the reduced certainty over future cash flows and additional up-front cost. If you’re not convinced by either option and want a bob each way, spreading your risk across several terms is also an option.
Appendix: Regional Heatmap
Our housing market heatmap provides a snapshot of the relative strength of housing markets up and down the country.
- Convergence has been the most obvious theme in the temperature shifts between our March and June editions of the Regional Heatmap
- The previously cooler climes of the North are thawing while the degree of Southern outperformance in the house price stakes has lessened.
- That’s not so much on the activity front though where (outside of Gisborne and Northland) houses in the North continue to change hands at a slower pace than further South.

[1] All mortgage rates quoted are average of four major banks’ ‘special’ rates, sourced from interest.co.nz
To subscribe to Mike’s updates click here
Disclaimer: This publication has been produced by Bank of New Zealand (BNZ). This publication accurately reflects the personal views of the author about the subject matters discussed, and is based upon sources reasonably believed to be reliable and accurate. The views of the author do not necessarily reflect the views of BNZ. No part of the compensation of the author was, is, or will be, directly or indirectly, related to any specific recommendations or views expressed. The information in this publication is solely for information purposes and is not intended to be financial advice. If you need help, please contact BNZ or your financial adviser. Any statements as to past performance do not represent future performance, and no statements as to future matters are guaranteed to be accurate or reliable. To the maximum extent permissible by law, neither BNZ nor any person involved in this publication accepts any liability for any loss or damage whatsoever which may directly or indirectly result from any, opinion, information, representation or omission, whether negligent or otherwise, contained in this publication.