The economy in ten pics
16 Aug 2024- RBNZ kickstarts the easing cycle
- Greenlights a slow ‘n’ steady downtrend
- Helps the 2025 economic outlook, but near-term growth picture still troubled
- With labour market to weaken further
- Housing market in focus
Chart 1: So it begins
There was nothing in the Reserve Bank’s (RBNZ) announcement to greatly challenge our view of the world. The Official Cash Rate (OCR) was lowered 25bps to 5.25% as we expected. The interest rate brake is still on, just less so than before.
The most important aspect of the meeting in our view was the confirmation that the OCR will move a lot lower over the coming 18 months.
It needs to. Our rough estimate of the ‘real’ (inflation-adjusted) cash rate has increased in recent months, even with this week’s cut. And it’s a long way down for the OCR to the RBNZ’s estimate of the long-run neutral rate around 3%.
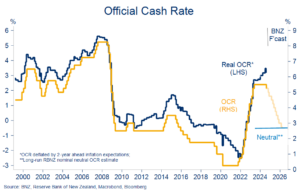
Chart 2: Chop
The RBNZ’s updated forecasts were a shadow of their former selves. GDP growth, inflation and OCR forecasts got a chop while unemployment rate expectations were lifted ½% or so to a 5½% peak.
This brings the RBNZ’s view of the economy down to, or even a touch weaker than, where we’ve been seeing things. Importantly, CPI inflation is now seen well inside the 1-3% target range in Q3 (2.3%y/y from 3.0% in May). As of yesterday, we concur.
It means there’s a higher hurdle for incoming data to surprise the RBNZ on the downside. That doesn’t rule out a larger 50bps OCR cut being deployed at some point, but it does lean against the possibility in the short term.
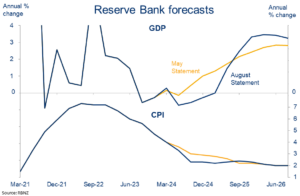
Chart 3: Joining the rate race
Having been something of an outlier for a while, NZ is now back in the policy easing peloton. Most developed markets anticipate sizeable interest rate cuts over the coming 12 months.
Markets price a better than even chance of a 50bp start to the US Federal Reserve’s easing cycle next month which, if delivered, may embolden global rate cut pricing further.
Of those markets covered opposite, implied policy easing to February 2025 is most aggressive for the US (-185bps), NZ (-150bps), and Canada (-130bps), with Australia (-65bps) and Japan (+10bps) at the other end of the field.
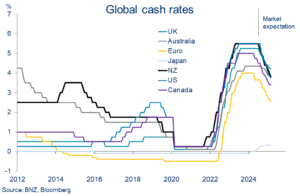
Chart 4: US sniffles
Global financial markets have recovered much of their poise following the steep equity market declines of early last week. Sentiment is not what it was though. Investors are suddenly alert to any number of global fragilities.
Most of the ‘blame’ for the wobble has been pinned on cooling tech/AI exuberance and US growth concerns. The outsized reaction last week may reflect the additional, creeping reliance on the US to drive the global expansion this year. The old ‘US catches a cold’ adage is still relevant.
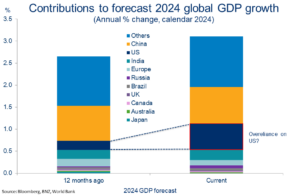
Chart 5: Jobs growth stalled
The number of people employed nudged up 0.4% in the June quarter, according to official figures released last week. We’d pencilled in a small decline. Unemployment still rose to 4.6% as expected.
Q2’s employment kick is unlikely to be repeated this quarter, and it also doesn’t change the broader narrative of jobs growth effectively stalling around mid-2023.
Amongst the sectoral detail, it’s clear that the construction sector has been at the vanguard of the changing employment market.
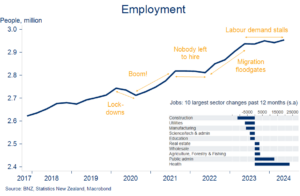
Chart 6: Relocating for work
The lift in NZ’s unemployment rate in Q2 maintained a ½ percentage point gap to the (4.1%) Aussie equivalent.
It doesn’t sound large, but that gap is the widest since 2013. Not coincidentally, net migration outflows to Australia are also running at the strongest level since 2013. People move to where the jobs are.
Our forecasts imply both trends have got a ways to run. A climb in the NZ unemployment rate to a 5.5% peak in early 2025 against a lower (4.6%) peak in Australia would, on past form, be consistent with an acceleration in net outflows.
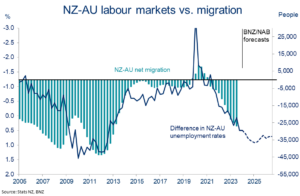
Chart 7: Green f(lags)
Wage inflation peaked in NZ about a year ago. We saw another notch in the downtrend last week. The private sector Labour Cost Index eased to 3.6%y/y in June, down from 3.8% the prior quarter and the 4.5% peak.
More of the same easing is expected over the coming 12 months. It’s something that should help drain still-elevated domestic services inflation pressure. So, it’s not that high interest rates have been ineffective on non-tradables inflation, it’s that the impacts take time to turn up. The lags are real!
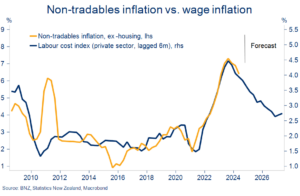
Chart 8: No retail respite
The trend in NZ retail card spending abruptly turned in early 2023, and it’s been downhill ever since. July’s 0.1%m/m contraction was the 6th consecutive monthly decline. Discretionary categories remain the hardest hit.
The weakness is even more pronounced once buoyant population growth is accounted for. Our estimate of the average monthly spend per (working age) person is 8% below March 2023 levels. It’s a deeper and longer contraction than during the 2008 GFC.
We’re hopeful the downtrend soon stabilises. Tax and interest rate cuts are supports, but falling population growth and job security are not.
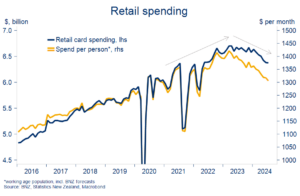
Chart 9: Housing market in focus
The release of July REINZ housing market numbers has been shunted out to Tuesday, thus missing the cut for this edition of TEITC.
But, it’s fair to say, housing stats will be watched more closely than usual as folk scour for green shoots in a sector likely to be one of the earlier responders to (recent and expected) falls in retail interest rates. There are stirrings in some of the anecdote and surveys, but we think the prognosis is more stabilisation than acceleration, for now.
In the least, we’d expect a hearty bounce-back in July sales activity following the outsized, Matariki holiday-related, drop in June. That’s what we saw from this week’s Barfoot & Thompson figures covering a share of the Auckland market.
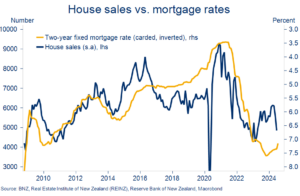
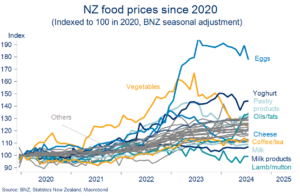
Chart 10: Food for thought
Food prices lifted 0.4%m/m (seasonally adjusted) in July. Prices have been flattish for the past year, but they’re still up 24% on 2020 levels.
As you’d expect, there’s been a fair bit of variation amongst the components over that time. If you’re partial to an omelette and/or yogurt for breakfast you will be feeling the pinch a lot more than some. At least your morning brew is still, relatively speaking, cost effective.
To subscribe to Mike’s updates click here
Disclaimer: This publication has been produced by Bank of New Zealand (BNZ). This publication accurately reflects the personal views of the author about the subject matters discussed, and is based upon sources reasonably believed to be reliable and accurate. The views of the author do not necessarily reflect the views of BNZ. No part of the compensation of the author was, is, or will be, directly or indirectly, related to any specific recommendations or views expressed. The information in this publication is solely for information purposes and is not intended to be financial advice. If you need help, please contact BNZ or your financial adviser. Any statements as to past performance do not represent future performance, and no statements as to future matters are guaranteed to be accurate or reliable. To the maximum extent permissible by law, neither BNZ nor any person involved in this publication accepts any liability for any loss or damage whatsoever which may directly or indirectly result from any, opinion, information, representation or omission, whether negligent or otherwise, contained in this publication.