Where are we all going? (reprise)
12 Nov 2024
- Slowdown from last year’s record population growth felt across most regions
- More to come, holding back the strength of the house price upturn and broader economic recovery
- Auckland tops the 2024 population growth stakes for the second year running
- Internal migrants continue to ‘flee the cities’, with region hoppers looking favourably upon Northland, Otago, Canterbury, and Tasman
The shape of NZ’s changing regional population profile is always a popular point of discussion. Since we wrote on it last year, population growth has peaked and turned rapidly lower. Here, we take another tour of the regions to see how this slowing has been experienced, and what the impacts might be.
Chart 1: The big get bigger
NZ’s population increased by 1.8% in the year to June 2024.[1] That’s still above average but a decent come down on last year’s 2.5%y/y.
Net international migration inflows accounted for roughly 80% of this population increase. The Auckland region once again captured the vast majority of these and hence topped the population growth stakes.
Waikato and Canterbury weren’t far behind, with both enticing folk to move in from other parts. Nelson, by contrast, seems to be out of favour. In fact, the region would have recorded a reasonable population decline were it not for migration inflows.
[1] All population data based on Stats NZ’s annual Subnational Population Estimates (which are provisional for the year to June 2024)
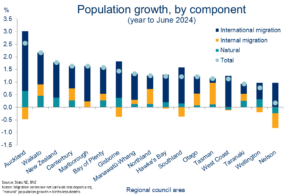
Chart 2: What goes up
The come down from last year’s record growth in population numbers was felt across most regions.
Marlborough was the only one to experience an acceleration in population growth of any note.
Canterbury and Otago saw the largest slowing. That surprised us a little, even taking Stats’ population estimates with the required grain of salt. The same two regions have spent most of the past two years hugging the more resilient end of the regional economic rankings.
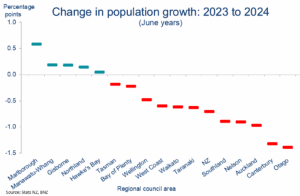
Chart 3: Growth in business numbers slows
Evidence of this mainland outperformance can be found in the separate, and recently released, Business Demography Statistics.
In the 12 months to February 2024, growth in new business units was the strongest in Canterbury and Otago. In the case of the latter, it was even above the long-term average. In
a recession.
Meanwhile, Wellington’s struggles were laid bare in the form of an outright decline in business units.
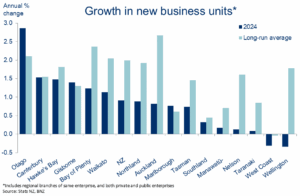
Chart 4: Build and they will come?
This year’s changes aside, the overall stock of business units across the country, perhaps unsurprisingly, roughly matches the spread of people.
Auckland is a modest outlier in having a higher share of the country’s business units than it does people. And that’s even with Auckland’s population boom of the past two years.
Otago is similarly inclined while the Manawatu and Wellington regions have a relatively high share of people compared to business numbers.
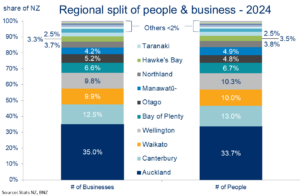
Chart 5: Fan out
The slowing in population growth this year is of course entirely driven by the deflation of the international migration boom.
With the boom in the rear-view mirror, it’s a good time to take stock. Of the 180,000 net migrant inflows of the past two years, just over half settled in Auckland. That’s equivalent to half a Hamilton, or two Whanganuis.
But while the spread of new migrant numbers was quite concentrated, it’s been much less so as a share of individual regions’ populations.
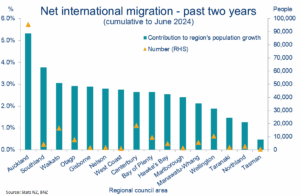
Chart 6: Upping sticks
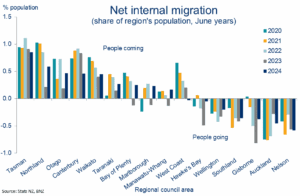
Alongside the international migration “in”, there’s been a continued net internal migration* “out” of the likes of Wellington, Auckland, and Southland.
Areas impacted by extreme weather events like Hawke’s Bay, Gisborne, and Nelson also show a strong net outflow recently (albeit Gisborne and Hawke’s Bay’s net outflow was much reduced from 2023).
Conversely, region hoppers continue to look upon Northland, Otago, Canterbury, Waikato, and Tasman in a favourable light (movers to the latter likely coming from up the road in Nelson).
*Movers that have lived in a region for more than a year
Charts 7: Convergence
These regional internal migration trends have been in play for a while. But the rates at which people moved in 2024 were, overall, a touch slower than the past few years.
Some of this might reflect the maturing of pandemic-era trends like being able to work from anywhere (Northland and Otago certainly appeal to this scribe). But we reckon ongoing convergence in regional house prices may be a bigger factor.
Auckland is not as expensive, relatively speaking, as it was. Waikato and Canterbury are not as ‘cheap’.
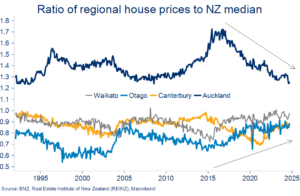
Chart 8: City offramp
Nonetheless, looking at internal migration crosswinds at a more disaggregated level shows there’s still a strong ‘flee the cities’ vibe in play. Especially the cities of Wellington, Nelson, and Auckland (excluded from the chart).
The Selwyn and Waimakariri districts (southwest and north of Christchurch respectively) remain the most in vogue places to up sticks and shift to.
The 35% population explosion in Selwyn from 2018-2024 is easily the largest of any district in NZ over this period.
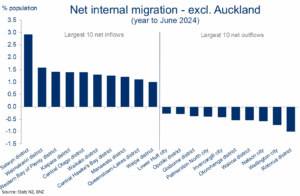
Chart 9: No vacancy
It may have been uneven around the regions, but the impacts of the population growth slowdown have become increasingly obvious everywhere.
We think it was part of the reason economic activity slumped anew around mid-year. And the associated easing in housing demand has contributed to NZ’s rental and housing markets returning to a position of excess supply.
Indicative of such, rental vacancy rates have increased in all regions over the past 12 months, and particularly so in Auckland and Wellington. No wonder rents are now falling in some areas.
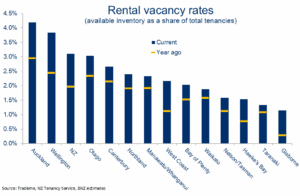
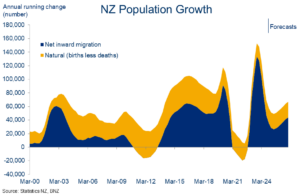
Chart 10: More to go
The population figures used here mostly reference the year to June 2024. We know migration flows have cooled further since. And our forecasts anticipate more of the same through next year.
In other words, the slowdown in population growth is only partway done. We expect the current annual growth rate of 1.8% to dip to around 1.0% in 2025. It’s one of the factors expected to hold back the house price upturn, and broader economic recovery, we see developing next year.
To subscribe to Mike’s updates click here
Disclaimer: This publication has been produced by Bank of New Zealand (BNZ). This publication accurately reflects the personal views of the author about the subject matters discussed, and is based upon sources reasonably believed to be reliable and accurate. The views of the author do not necessarily reflect the views of BNZ. No part of the compensation of the author was, is, or will be, directly or indirectly, related to any specific recommendations or views expressed. The information in this publication is solely for information purposes and is not intended to be financial advice. If you need help, please contact BNZ or your financial adviser. Any statements as to past performance do not represent future performance, and no statements as to future matters are guaranteed to be accurate or reliable. To the maximum extent permissible by law, neither BNZ nor any person involved in this publication accepts any liability for any loss or damage whatsoever which may directly or indirectly result from any, opinion, information, representation or omission, whether negligent or otherwise, contained in this publication.


