Eco-Pulse: Interest rates widening housing cost relativities
18 Sep 2023
- Both rental and house price inflation lift further
- Rent vs. buy comparisons tricky to get like-for-like
- But cash costs of buying now well above renting
- As higher interest rates drive a wedge
- House prices the key swing factor
Housing costs continue to rise. Both rental price and house price inflation are turning higher, in line with our prior expectations (outlined here and here).
Over the past week we learned annual rental price inflation for new tenancies punched up to 6.2% in August, from 4.1% in July (Stats NZ figures). Meanwhile, house prices notched up their fourth consecutive monthly increase since the market turned in April (in seasonally-adjusted terms). That brings the cumulative increase in the REINZ House Price Index over that period to 2.4%. A boom it ain’t, but the run-rate of monthly price increases is still ahead of what we might have expected this side of the election.
Convincingly turned
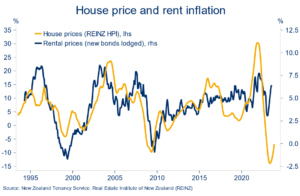
One of the strongest drivers of higher rent and house price inflation is migration, which was revealed last week to have hit the highest level on record. Net annual inflows squeaked past 96k in July. That was despite long-term departures rising to an 11-year high of 112k. Yes, there are clear signs the monthly pace of inward migration is now slowing. But at a time of tight housing supply, the extra population growth is likely to sustain solid rates of rental and house price inflation over the coming 12 months.
But what are the cost relativities between the two? We’re often asked about the relative costs of renting vs. buying. It’s a difficult question to provide a straight answer on. They’re inherently different propositions.
Leasing a property for a set period is a lower risk, operational-type expense. Buying a house represents (for most) a large, leveraged balance sheet exposure that opens up a bunch of extra risks and opportunities. In the least, it’s important to get as close as possible to an ‘apples with apples’ cost comparison.
We’ve tried to do so by running a couple of hypothetical examples:
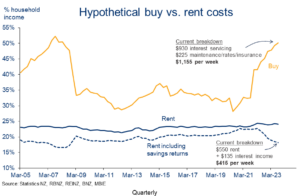
- A home is purchased at the NZ median house price (currently 780k), financed with a 20% deposit and the remaining 80% as (interest only) debt. Interest costs are split equally across floating and 2-year fixed mortgage rates. To this we add maintenance, rates, and insurance costs at an assumed annual rate of 1.5% of the national median house price.
- A new tenancy is entered into at the NZ median rent ($550 per week). To make it a fair comparison, the 20% house deposit deployed in the ‘buy’ example above is left earning interest in the bank. These (after-tax) interest returns partially offset total rent costs. For clarity we’ve split the effect out in the chart below (see the blue lines).
Widening wedge
The results are averages and approximations, and hence clearly won’t reflect all situations. But we can draw the following high-level conclusions:
- In terms of operational costs – the cash leaving a bank account each week – the costs of servicing a new house purchase are currently much more expensive than equivalent rent costs. On our numbers that’s always the case, but particularly so at the moment. Current cash ownership costs for a new purchase have increased to around 50% of average household incomes, compared to around 30% in 2020. Rent costs, by comparison, have nudged up to an average 24% of household incomes, or 18% once interest earnings are added back in (we’ve assumed for comparability that renters park a 20% house deposit in the bank. This makes the comparison fair but of course may not reflect reality).
- Over the past five years, higher buy costs have been driven in roughly equal parts by big increases in mortgage rates, which are cyclical, and higher house prices, which are less so. Rents have risen rapidly too (as we’ve covered recently), but not by as much as debt servicing costs.
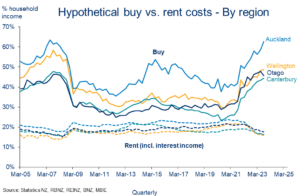
- The divergence is largest in Auckland (63% of income to service a new home vs. 24% of income to rent, or 16% when savings income is added in) but is observable in all regions. Average servicing costs remain lowest in Canterbury reflecting lower house prices.
- Overall, it’s clear that high interest rates have widened the wedge between the costs of renting vs. buying.
Auckland has the largest divergence
Despite all of the above, it’s not necessarily the case that renting will turn out to be the most cost-effective option over the long-term. First, inflation tends to deflate the value of borrowers’ debt over time, while rent payments tend to rise with inflation. But more importantly, what happens to house prices ends up being the key swing factor. And no one knows what’s going to happen there.
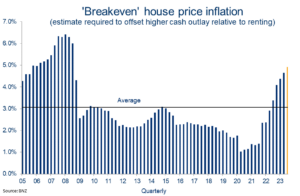
For example, the average expense associated with purchasing the median New Zealand home currently exceeds that of renting by just over $38k p.a. according to our back-of-the-envelope numbers. That’s seemingly a large number to overcome. But if house prices were to rise by around 5% over the coming year, this shortfall would be entirely offset by a positive house price revaluation (admittedly a paper ‘gain’ rather than cash). In contrast, if house prices were to go in the other direction it would dramatically increase the shortfall.
Plotting this concept of the rate of house price inflation required to “breakeven” on the higher cash costs of buying yields the chart opposite. Consistent with our earlier analysis, it shows, on average, positive rates of house price appreciation are always required to breakeven. The current estimate of such is well above average and the highest since 2008.
Finally, all this number crunching is all well and good, but it risks missing the point for some. We’ve deliberately focused on the financials here and excluded all the big non-financial and circumstantial considerations involved in a buy/rent decision.
It’s hard to put values in the spreadsheet for things like security of tenure and being able to hang your pictures up or renovate. When it comes down to it, these may well end up being the most important in the decision.
Subscribe to Mike’s updates here
Disclaimer: This publication has been produced by Bank of New Zealand (BNZ). This publication accurately reflects the personal views of the author about the subject matters discussed, and is based upon sources reasonably believed to be reliable and accurate. The views of the author do not necessarily reflect the views of BNZ. No part of the compensation of the author was, is, or will be, directly or indirectly, related to any specific recommendations or views expressed. The information in this publication is solely for information purposes and is not intended to be financial advice. If you need help, please contact BNZ or your financial adviser. Any statements as to past performance do not represent future performance, and no statements as to future matters are guaranteed to be accurate or reliable. To the maximum extent permissible by law, neither BNZ nor any person involved in this publication accepts any liability for any loss or damage whatsoever which may directly or indirectly result from any, opinion, information, representation or omission, whether negligent or otherwise, contained in this publication.