Eco-Pulse: Where are we all going? (in pictures)
13 Nov 2023
- Auckland at the centre of the migration-driven population boom
- Even as a “flee the cities” internal migration trend remains in-play
- House price/rent pressures mixed around the grounds, given supply-side differences
- But general economic activity clearly stronger in regions experiencing higher population growth
The migration-driven population boom has been a defining feature of the economy this year. The impacts on the likes of rents, house prices, spending, and the labour market look set to persist well into 2024. In this short chart pack, we scratch the surface a little, and have a closer look at how the upturn in population growth has been experienced around the regions.
Big city life
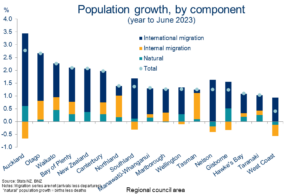
NZ’s population increased by 2.1% in the year to June 2023, a big bounce from essentially no growth last year.[1] The vast majority of this lift was thanks to international migration inflows.
The Auckland region captured most of these migrant inflows and hence enjoyed the strongest population growth in the country.
Otago wasn’t far behind, helped by folk in other NZ regions upping sticks and shifting south. The mountains, the lakes…who could blame them?
[1] Population data based on Stats NZ’s Subnational Population Estimates (which are provisional)
Spread out everyone
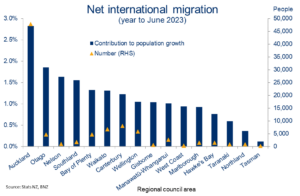
So, there’s more evidence that Auckland is the first port of call for inbound migrants. A full 55% of net inflows in the year to June landed in our biggest city.
Nevertheless, it’s notable that, while the migration boom may not have been well spread in terms of raw numbers, it has been well dispersed relative to regions’ populations.
Auckland blues
Alongside the big international migration “in”, the other thing that stands out about Auckland’s population is the notable internal migration “out”.
Does this simply reflect new migrants moving on to other parts of the country? Nope. To be classed as an internal migrant you need to have lived in a region for at least a year. What’s more, Auckland’s net internal population outflow is a trend that was established before the borders reopened and international migration ramped up.
Indeed, regional trends in internal migration were amplified during the 2020-2022 lockdown years, but appear to have been mostly already in place.
Inner city pressure
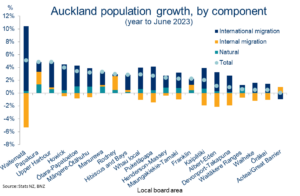
Zooming in on Auckland a little more shows the ‘international in, internal out’ vibe is common to most districts, but especially so in Waitematā (CBD and inner-city suburbs).
Stats NZ estimate there’s been a gross population shift in that region of around 15% thanks to a net international migration influx equivalent to 10% of the population and net internal departure of 5%.
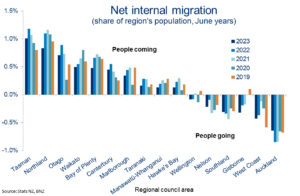
Life is better in the country
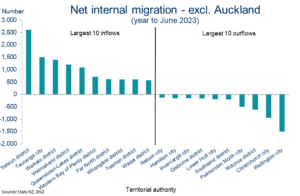
It’s not just Auckland. There’s a general ‘flee the cities’ vibe in play in other parts of the country too. Christchurch and Wellington especially.
The Selwyn, Tauranga, Waikato, Waimakariri, and Queenstown-Lakes districts are picking up the lion’s share of these outflows.
The trend towards working from anywhere might explain some of this, but we suspect the bigger driver is an aversion to the high cost of housing in our larger cities. It’s why house price cycles tend to start in the cities and ripple outwards.
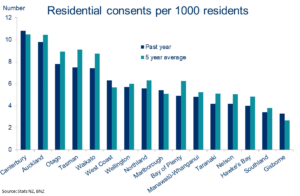
We’re not getting any younger
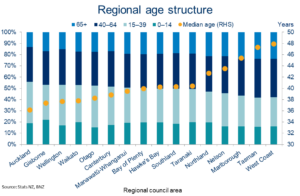
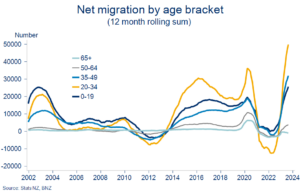
Being the recipient of the majority of NZ’s international migration inflows will, at the margin, be contributing to the fact the Auckland region has the country’s youngest population. Migration inflows have been concentrated in the 20-34 age bracket.
But the more important factor will be Auckland’s relatively high rate of natural population growth (see first chart). Same for Gisborne, our second youngest region.
At the other end of spectrum, a combination of strong internal migration and a relatively older population suggests the Tasman region is benefitting from retiree inflows. The region has experienced the (equal) largest lift in median age over the past two years.
The NZ-wide median age has lifted from 37.2 years in 2018 to 38.0 in 2023.
Build and they will come?
It’s clear strengthening population growth is putting upward pressure on both house prices and particularly rents.
But these pressures are not necessarily most obvious in those regions experiencing the largest population growth.
The supply side also matters. And it turns out that those regions experiencing the strongest population growth – Auckland, Otago, and Waikato for example – have also been the busiest builders over the past few years.
Tighter supply
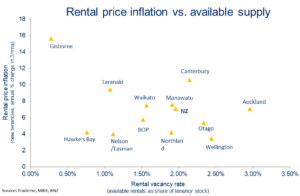
Conversely, it appears that those regions that have experienced lower residential building activity in recent years – such as Gisborne, Taranaki, and Hawke’s Bay – are facing tighter rental supply (see our note from earlier in the year).
Some but not all of these regions are also experiencing larger rent increases. Recent weather devastation may also be a factor.
Power in numbers
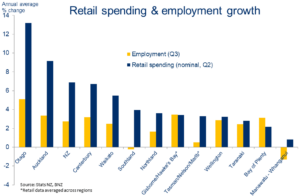
If they’re not (yet?) obvious in regional house price & rent comparisons, population growth differences do appear to be showing up in labour market metrics and retail spending growth. We’d be surprised if they weren’t!
It highlights, again, the mixed nature of the economic slowdown across the economy’s sectors and regions. Everyone is feeling it, but some more acutely than others.
To subscribe to Mike’s updates click here
Disclaimer: This publication has been produced by Bank of New Zealand (BNZ). This publication accurately reflects the personal views of the author about the subject matters discussed, and is based upon sources reasonably believed to be reliable and accurate. The views of the author do not necessarily reflect the views of BNZ. No part of the compensation of the author was, is, or will be, directly or indirectly, related to any specific recommendations or views expressed. The information in this publication is solely for information purposes and is not intended to be financial advice. If you need help, please contact BNZ or your financial adviser. Any statements as to past performance do not represent future performance, and no statements as to future matters are guaranteed to be accurate or reliable. To the maximum extent permissible by law, neither BNZ nor any person involved in this publication accepts any liability for any loss or damage whatsoever which may directly or indirectly result from any, opinion, information, representation or omission, whether negligent or otherwise, contained in this publication.