Eco-Pulse: Staggered start to 2024 for regional economies
16 Jan 2024
- Economic challenges widespread
- But mainland resistance an obvious feature of our stocktake of regional economic relativities
- Auckland also displaying relative sturdiness, while rebuilding activity lifts Gisborne numbers
- Population growth and rural exposures divide performance
Happy New Year! In case you missed it we laid out our thoughts about the 2024 outlook just prior to the holiday break. It’s shaping up as another challenging year overall, but the tentative turning in the cycle we’ve got pencilled in for the latter part of the year stands in contrast to the steady deterioration we saw through 2023.
That’s the general picture. In our travels, though, we always encounter heightened interest in what’s going on under the hood. That is, how the regions stack up.
We’ll be able to let you know for sure in March 2025 when the official regional GDP numbers covering 2023 are released. In the meantime, we’ve pulled together the key threads of recent regional economic performance below. Bear in mind regional data can be a little patchy and fiddly. We’ve tried to arrange things broadly by sector. So that’s: housing, rents, construction, population, labour market, spending, and manufacturing/services.
Summary – Mainland Resistance
Cutting to the chase, everywhere is doing it tough. But it’s clear the South Island, and Otago in particular, is out in front when it comes to regional relativities. The ongoing tourism recovery is obviously important in this regard but there appears to be a self-sustaining element in the mix too given strong internal migration and construction activity. Canterbury and Otago’s relative sturdiness even carries through to the manufacturing sector which, in absolute terms, is under clear strain in all parts.
Auckland and, in some areas, Waikato occupy the next rung down thanks to buoyant population growth and its obvious links to housing activity. The Gisborne region continues to face big challenges associated with the storms of 2023, but some of the associated rebuilding activity is popping up at the stronger end of some of our metrics.
Things aren’t always as clear cut at the relatively weaker end of the spectrum. But the likes of Taranaki, Manawatu-Whanganui, Nelson/Tasman, and Northland make more regular appearances at the slower end of our charts than others. Wellington is middling at best. The rough and ready schematic below provides a summary.

Indicative summary of regional relativities
It appears there’s a couple of big macro thematics dividing regional performance. That’s even as they all face into the same overall pressures from high interest rates, elevated cost pressures, and lacklustre global demand. The first is people, both tourists and migrants, and to which parts of the country they’re mostly headed. The second is the larger strain placed on those parts of the country with strong links to the downtrend in commodity export prices we’ve seen over the past two years.
From here, we can see a case for the extent of regional economic divergences to narrow. Not necessarily in a good way – the lagged impact of high interest rates and other late-cycle impacts will drag down all parts. But we do think agricultural export prices might be stabilising, which would lessen some of the headwinds facing our more rural-orientated regions.
House prices – Auckland, Waikato, Wellington
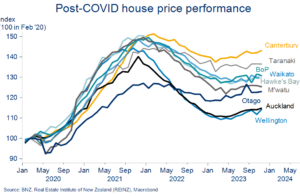
National house prices eked out a small 3% lift over the second half of 2023. The bounce was small but symbolic, bringing to an end a 17-month downtrend in which prices fell 16% from the 2021 peaks.[1]
Together on the up, apart on the down
An often-overlooked aspect of the downturn was that it was very Wellington (-23%) and Auckland (-21%) centric. House prices in Otago, Taranaki and Canterbury, for example, largely shuffled sideways over the same period. And now, along with most other regions, they’re rising anew.
A glance at our regional housing market heatmap shows which regions are leading the upturn. House prices in Waikato, Auckland, and Wellington have risen the most since the market turned mid-year. The former two likely reflect above average population growth, while Wellington’s outperformance is more of a head scratcher, and probably a dead cat bounce.

Housing market turnover has yet to really get going anywhere. The pace of monthly house sales is still stuck 15-20% below the long-run average, adding to the indicators suggesting the upturn in house prices this year will be more grind than roar.
Relatively speaking, Northland and Southland have experienced the largest lift in sales to date, but to still below average levels in both cases.
Rents – Gisborne, Hawke’s Bay, Taranaki
Wellington is one of only two regions not experiencing an outsized burst of rent inflation (the other being the West Coast). The latest tenancy data to October shows annual growth in new tenancy rents exceeding 5% everywhere else.

Smaller regions catching up
It’s climbed to 9% y/y in Auckland and Canterbury, and is well into double digits in Gisborne, the Hawke’s Bay, and Taranaki.
Zooming out a bit, as in the chart opposite, shows how much rents have converged over the past five years. Rents in the regions have been rapidly catching up to those in Wellington and Auckland as internal migration has effectively ‘exported’ housing shortages to the regions.
Construction – Southland, Otago, Canterbury
The downturn in residential construction appears to be gathering pace. We expect activity to contract for most of this year.
To get a sense of where this might be felt most acutely we can look at residential consenting numbers. Inherent volatility and sample size issues in smaller regions need to be acknowledged up front. But if we look at the cumulative six months to November, around 6% fewer building consents were lodged than the six months prior (the peak to trough decline is now around 40%).
Wellington and Auckland account for most of this six-monthly decline. Taranaki, Tasman, and the Hawke’s Bay are other weak spots. Tasman aside, consenting numbers in the South Island – notably Southland, Otago, and Canterbury – have been holding up a better than the national average. Indeed, they’re up in the six months to November relative to the prior six months.

Slump in consents concentrated in Auckland, Wellington
This North vs. South thematic also shone through in the more dated, ‘official’ construction statistics referencing the September quarter. Auckland was an exception – it was the only regional grouping in which annual growth in building activity remained positive in the third quarter.
Population growth – Auckland, Otago, Waikato
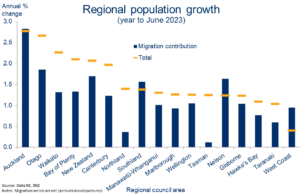
Population growth in NZ is humming. On our reckoning, the 2.7% growth in the year to September is the strongest in 76 years. Net inward migration accounts for about 90% of this. By contrast, ‘natural’ population growth (births less deaths) remains in steady decline, as it does in most parts of the developed world.
The majority of inbound migrants settle in Auckland so it was no surprise to see our largest city top the regional population growth stakes (year to June). Otago, Waikato, the Bay of Plenty, and Canterbury rounded out the top five fastest growing regions.
More people = more activity
Recovering numbers of shorter-term (i.e. tourist) arrivals have also bolstered activity in those regions with strong tourism links, Otago in particular. As at October, tourism numbers were back to around 80% of pre-COVID levels. The trend recovery should continue this year, albeit at a slower pace than what we’ve seen to date.
The latest passenger numbers from NZ’s international airports show heady growth in international passenger numbers continuing (data to November, ex-Wellington), especially so in Auckland and Christchurch.

Booming passenger numbers through AKL, CHCH
Labour market – Otago, Gisborne, Auckland
Labour market conditions cooled dramatically in 2023 as the surge in migration swelled the pool of available workers. Wage growth is now slipping as a result. The pace of hiring slowed only a little, though, as firms used all the extra supply to backfill existing vacancies.
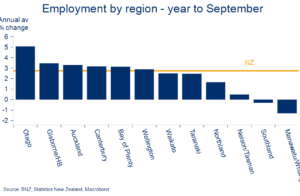
Delving into the regional info, we find that those regions enjoying higher-than-average population growth have also, unsurprisingly, had the strongest performing jobs markets. Auckland, Canterbury, and Otago again feature at the thick end of the chart. Migrants tend to follow opportunity.
Otago’s got the jobs
The Otago employment market will have received an additional kicker from heightened construction activity, as well as recovering tourism and international student flows. Stronger-than-average employment growth in Gisborne and the Hawke’s Bay may reflect cleanup and reconstruction-related activity.
At the other end of the spectrum, Manawatu and Southland were the only regions to record outright employment declines in the latest (year to September) official labour market figures from Stats.
The more timely SEEK job ads figures, for November, point to labour demand being wound back further as we approached year-end. This was particularly concentrated in Auckland and Wellington, and less so in the South Island.
Job ads are now 35% below the 2022 peak. Auckland and Wellington are off 39% and 37% respectively. Basically, the message from firms in these regions is “we’re full”.
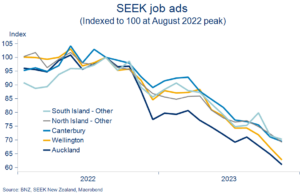
Job ads 35% below 2022 peak
There appear to be more opportunities in the South Island and regional North Island. This might explain why SEEK’s Advertised Salary indices are still chugging along at healthy levels in Canterbury and ‘Other South Island’ (6.7% and 6.0% respectively) but have cooled to 5% or lower elsewhere.
Retail – Otago, Gisborne, Canterbury
Retail spending has been running to stand still for the past 18 months. While the value of spending has continued to expand, the volume of stuff leaving shop floors has declined for six of the last seven quarters. We’ve been spending more to get less. Bear this is mind for the graph below for which only the value of spending is available by region. The growth numbers may look large but it’s mostly higher prices.
If you think of the spending pulse as largely driven by all that’s gone before – employment, population, house prices, and construction – it’s of no surprise to see Otago, Canterbury and Auckland again out in front given these regions’ outperformance elsewhere. Gisborne features strongly again too, likely reflecting replacement spending following 2023 flood damage.
There are a couple of obvious exceptions. Spending in the Waikato and Bay of Plenty remains very weak despite good showings in the house price, population, and employment stakes. Meanwhile, Manawatu-Whanganui, Southland, and Taranaki again turn in sub-par numbers as they have in some other areas.
These regions with strong exposures to agricultural export prices are clearly feeling the pinch from the declines we’ve seen over the past couple of years, not to mention the explosion in on-farm operating costs. Spending and investing appetites are unsurprisingly in the doldrums.
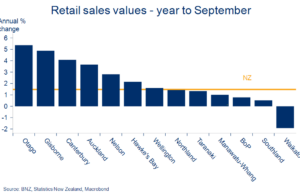
Wallets snapping shut in Waikato
We can get a slightly more up to date feel for the regional spending pulse from December quarter regional consumer confidence figures. Confidence nudged up a little overall, but to still below average levels. All regions bar Manawatu/Taranaki shared in the Q4 gains, with confidence now the highest (relative to average) in Canterbury and the Bay of Plenty.
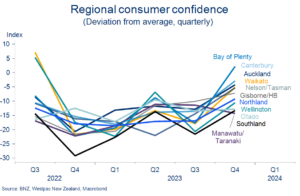
Consumer confidence lift led by BoP, Canterbury
Manufacturing/Services – Canterbury and Otago
The monthly Performance of Manufacturing (PMI) and Performance of Services (PSI) indices give us a decent early lead on business activity. Both spent much of 2023 stuck around recessionary levels.

Canterbury, Otago fronting services pick-up
As it has globally, manufacturing activity suffered relatively more last year thanks to weak global demand, sub-par construction activity, and the post-pandemic hangover in buying ‘stuff’. The pain continues to linger – the latest (November) PMI, at 46.7, is still well south of the 50.0 ‘breakeven’ level.[2] The chart shows that this weakness has been shared around the regions relatively evenly, albeit with Otago and Canterbury a touch more resilient.
In contrast, service sector activity appears to be getting back on the front foot, with Otago/Southland and Canterbury leading the way. This is more likely to be a population growth story than 2022’s more tourism-related burst of service sector activity. If that’s so, it’s interesting that the “Northern” subcomponent of the PSI is lagging even though Auckland and Waikato are out in front in the population stakes.
[1] REINZ House Price Index used for all, BNZ seasonal adjustment.
[2] A PMI reading above 50.0 indicates that the sector is generally expanding; below 50.0 that it is declining.
To subscribe to Mike’s updates click here
Disclaimer: This publication has been produced by Bank of New Zealand (BNZ). This publication accurately reflects the personal views of the author about the subject matters discussed, and is based upon sources reasonably believed to be reliable and accurate. The views of the author do not necessarily reflect the views of BNZ. No part of the compensation of the author was, is, or will be, directly or indirectly, related to any specific recommendations or views expressed. The information in this publication is solely for information purposes and is not intended to be financial advice. If you need help, please contact BNZ or your financial adviser. Any statements as to past performance do not represent future performance, and no statements as to future matters are guaranteed to be accurate or reliable. To the maximum extent permissible by law, neither BNZ nor any person involved in this publication accepts any liability for any loss or damage whatsoever which may directly or indirectly result from any, opinion, information, representation or omission, whether negligent or otherwise, contained in this publication.


