Eco-Pulse: Housing under-build – where could we be most short?
27 Feb 2024
- Housing supply looks set to undershoot population requirements this year
- Most regions will be impacted
- On a longer-term view, Waikato, Bay of Plenty, Gisborne, Hawke’s Bay, and Northland appear the most undersupplied
We’re not building enough houses for the population growth NZ is seeing. We’ve been talking about this under-build for a while (Property Pulse: Slow Build and Eco-Pulse: Buy or Build). It’s a key factor in the turning we’ve seen in the housing market and also the recent surge in rents.
If it’s become clearer that we’re falling short, the natural next question to ask is “where”? After all, we know that rates of home building and population growth vary up and down the country. In this short note, we run the numbers for the regions to get a sense of where the under-build might be felt most.
There are a few health warnings that go with this stuff. Estimates of housing demand vs. supply get bandied about a lot but the underlying data and assumptions mean the margins of error can be huge. In our view, the most we can get out of this analysis is a steer on the direction of travel and the high-level regional disparities within that.
2024 falling short
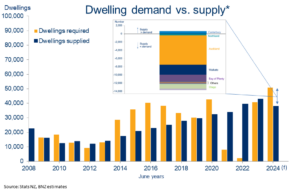
With those caveats ringing in our ears, and starting at the national level, we reckon we’ll need an extra 45-50k residential dwellings this year to accommodate the record population growth we’re seeing. That’s based on an average of 2.6 people per dwelling.
It’s highly unlikely these sorts of numbers will be delivered. Based on trends in building consents, the usual (6-12 month) lag from consent to building work completion, and separate Stats NZ data indicating around 9% of lodged consents either don’t get acted on or are to replace existing (demolished/depreciated) dwellings[1], we think no more than around 35,000 dwellings might actually get built. Those are our estimates for this year (to June). Current weakness in consent issuance points to additional falls thereafter.
Performing a similar exercise to the above for each of the main regions breaks down how this shortfall might be spread around the country. All of which is laid out in first chart (below opposite).
We estimate Auckland will make up the largest chunk of the absolute shortfall, unsurprising given its large population. A better way to get a read on relative housing pressures is to express the supply/demand balance as a share of individual regions’ populations.
Most regions impacted
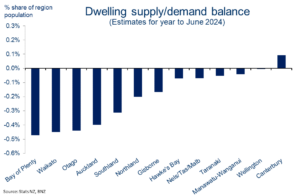
This is the basis of the second chart above. From this, we can see the biggest proportionate shortfalls this year are likely to be in the Bay of Plenty, Otago, Waikato, Auckland, and Southland. Gisborne and Northland too to a reduced extent. Most other regions are close enough to an even balance. We’d include Canterbury in this bracket too even though it technically squeaks into net surplus territory. Such are uncertainties of the estimation methods involved.
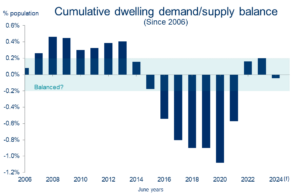
Those estimates and forecasts are all for the current (June) year. But you can’t just look at one year in isolation. There are always catch-ups and corrections going on from year to year. Looking at a cumulative position is needed to provide context. This is where it can get even trickier as we need to make a call on where to start cumulating from. Our view is a base of 2006 provides the ‘least wrong’ starting point.
Doing so yields the picture below. It’s well understood that we underbuilt over the period from 2015 to 2020, with the resultant dwelling shortage later mostly corrected following the border closure and associated stalling of population growth through the pandemic years.
Abstracting from the exact numbers, the important context here is that the expected underbuild this year is coming from a position closer to broad balance than, for example, the pre-existing shortages of 2015-2020. In other words, we’re going the wrong way directionally, but the starting point is not as unbalanced as it once was.
Less unbalanced than in the past
Splitting out the above cumulative demand/supply balance into the regions reveals some stark differences. Again, it’s the relativities rather than the absolutes that we should focus on here. The chart provides a snapshot of the current cumulative balance for each region.
Central North Island regions the most short
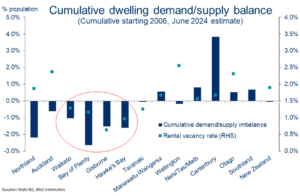
On our numbers, South Island regions – Otago, Southland, the Top of the South, and Canterbury are all in dwelling demand/supply positions near balance or even an excess of supply in Canterbury’s case. The latter reflects more than a decade of strong residential construction activity.
In contrast, there’s clearly a belt through the middle and eastern parts of the North Island in which dwelling construction has not kept pace with population growth. This includes Waikato, Bay of Plenty, Gisborne, and the Hawke’s Bay. Northland is also short.
There’s a couple of extra things worth pointing out here. First, over the past ten years, the Bay of Plenty and Waikato have consistently recorded the fastest population growth in the country. Second, rental vacancy rates in all of these central North Island regions are amongst the lowest in the country (i.e. there are few available rental listings relative to total tenancies). This supports the premise that these regions are afflicted with tighter-than-average housing markets. Some of the recent destructive weather events will not have helped.
Finally, Auckland, perhaps surprisingly, doesn’t stand out one way or the other. Despite enjoying stronger-than-average population growth, the region has built relatively strongly for a sustained period of time. That’s something that, along with Canterbury, is a key point of difference.
[1] We assume a higher consent non-completion rate over 2021-2023 reflecting capacity constraints within the construction sector.
To subscribe to Mike’s updates click here
Disclaimer: This publication has been produced by Bank of New Zealand (BNZ). This publication accurately reflects the personal views of the author about the subject matters discussed, and is based upon sources reasonably believed to be reliable and accurate. The views of the author do not necessarily reflect the views of BNZ. No part of the compensation of the author was, is, or will be, directly or indirectly, related to any specific recommendations or views expressed. The information in this publication is solely for information purposes and is not intended to be financial advice. If you need help, please contact BNZ or your financial adviser. Any statements as to past performance do not represent future performance, and no statements as to future matters are guaranteed to be accurate or reliable. To the maximum extent permissible by law, neither BNZ nor any person involved in this publication accepts any liability for any loss or damage whatsoever which may directly or indirectly result from any, opinion, information, representation or omission, whether negligent or otherwise, contained in this publication.