Eco-Pulse: Buy or Build
30 Oct 2023
- The average cost of building a home relative to buying existing has never been higher
- Increasing the odds we again end up underbuilding relative to the (booming) population’s needs
- We think the gap will narrow both via stabilising construction costs and higher house prices, but more so the latter
In short
Over the past couple of months we’ve had a look at the outlook for housing affordability (here) and the relative merits of buying vs. renting (here). A natural next step was to have a crack at the costs of building a new home vs. buying an existing one.
It’s an interesting exercise in its own right but it also has relevance for the macro outlook. An historically elevated ‘new build premium’ is part of the reason we’re forecasting:
- Residential construction activity to fall further despite strong population growth.
- The tentative upswing in house prices to gather pace next year. We continue to forecast a 7% lift in national house prices through calendar 2024.
Build costs skyrocket
Nailing down one all-encompassing measure of build costs is nigh on impossible given all the variables in play such as size, location, complexity, and spec. One thing that is clear though is that it’s become significantly more expensive to build relative to the situation only a few years ago. And that’s even before you factor in land costs. Depending on the measure you look at, construction costs have surged 35-45% over the past three years.
Kink in the trend
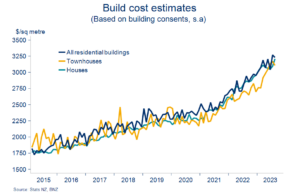
Based on the most recent consenting figures, the average NZ wide per-square-metre build cost is now just north of $3200. That’s an increase of about $1000/square metre from early 2020. That estimate is probably still on the low side given the potential for (and frequent reports of) cost overruns relative to what’s consented.
That said, the increase in per-square-metre costs noted above roughly matches the growth we’ve seen in various measures of final construction costs (chart below).
Construction cost measures in rough agreement

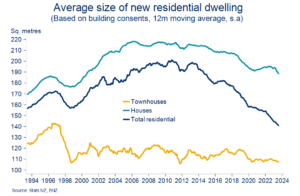
Smaller homes
One factor reducing the overall cost of building is the fact we’re building smaller homes. The average new residential dwelling is now around 140 square metres in size. That’s well down on the 190 square metre average from 2005-2014.
The explosion in town house construction from 2015 onwards accounts for much of this. But even looking at standalone houses only, the average size of about 190 square metres has clearly trended lower from the 215 square metre average through 2005-2015.
Despite the trend towards smaller builds, the average new build cost has still lifted around $100k on 2020 levels, to approximately $450k for all residential dwellings. For the average stand alone house the increase has been a larger 160k to just under $600k. Bear in mind that these figures don’t include costs related to design, consents and, of course, land.
Cost increases largest for stand-alone houses

Adding in the (median) cost of a residential section gets us a rough estimate of the total average cost to purchase a new house. This can then be compared to the cost of buying an existing home.
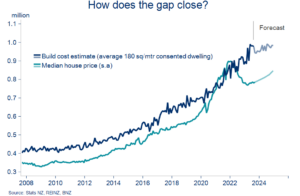
But first we need to alter the build cost estimate slightly to proxy a constant-size build. We’ve opted for 180 square metres (the post-2000 average). If we didn’t do this, build costs would be artificially ‘cheap’ compared to buying an existing house given the declining average size of new builds relative to existing homes.
Doing all this produces a cost to build estimate for an average residential dwelling of about $980k. That’s made up of a near $400k section cost and a $580k build cost. That compares to the median sale price of existing houses of $785k (REINZ data). The latter of course remains well down on the almost $900k peak of late 2021.
Build > Buy

So it’s more expensive to build. It nearly always is. Our analysis puts the average ‘new build premium’ over existing going back to 1995 at about $65k.
The fact there is a persistent new-build premium makes sense, and is consistent with anecdote. Relative to buying an existing home, an equivalent new build offers the buyer the ability to customise, meets code, and will generally be higher spec’ed (well insulated, double glazed etc.).
Still, there’s no getting around the sheer size of the current premium. The almost $200k difference between building and buying is around the widest ever on our numbers, and about three times the long-run average.
These numbers are of course indicative, they’re averages, and they vary by region. But they’re strongly consistent with the anecdote and feedback we’re getting around the traps. To the extent they’re representative of the decision facing the average punter, the general incentive to build rather than buy is very low.
Regional divergences – Otago is hot
Writ-large, these cost incentives matter. Witness the chart below in which we’ve mapped the ratio of house prices to building costs – essentially an ‘incentive to build’ proxy – against residential construction. There’s a tight relationship.
Disincentive
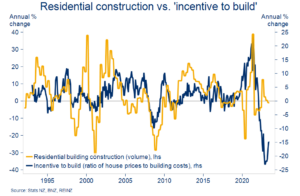
Elevated construction costs, lower house prices, and high interest rates are all currently conspiring against building activity. No wonder new building consent issuance has been in steady decline over the past two years. We’d also note that any existing incentive to build arising from the new build carve out from the 2021 removal of mortgage interest deductibility may soon depart. The incoming government intends to progressively restore deductibility to all properties.
All of this is potentially problematic in the current environment. We’re in the midst of a migration-fuelled population boom. There’s additional pressure on housing resources as can be seen in rents. If cost issues are disincentivising the building of new dwellings relative to existing homes, it raises the odds we again end up underbuilding relative to the population’s needs.
The implication is additional upward pressure on house prices as this extra housing demand finds its way relatively more into the existing home market.
This is essentially what we are forecasting. The currently wide gap in costs between building and buying should narrow. The breakneck pace of construction cost inflation is flattening off, and we expect this to continue. But, as the chart shows, this flattening doesn’t do much of the work in closing the build vs. buy gap. More of it is expected to come via higher house prices.
Upward pressure on house prices
Subscribe to Mike’s updates here
Disclaimer: This publication has been produced by Bank of New Zealand (BNZ). This publication accurately reflects the personal views of the author about the subject matters discussed, and is based upon sources reasonably believed to be reliable and accurate. The views of the author do not necessarily reflect the views of BNZ. No part of the compensation of the author was, is, or will be, directly or indirectly, related to any specific recommendations or views expressed. The information in this publication is solely for information purposes and is not intended to be financial advice. If you need help, please contact BNZ or your financial adviser. Any statements as to past performance do not represent future performance, and no statements as to future matters are guaranteed to be accurate or reliable. To the maximum extent permissible by law, neither BNZ nor any person involved in this publication accepts any liability for any loss or damage whatsoever which may directly or indirectly result from any, opinion, information, representation or omission, whether negligent or otherwise, contained in this publication.