Eco-Pulse: Expected housing affordability improvement flattened
5 Sep 2023
- Our housing affordability index is projected to drift roughly sideways from here, as expectations of solid income growth and eventual mortgage rate relief run into higher house price expectations.
- That represents a clear flattening of our previous assumption that affordability would stay on an improving trend. Stretched affordability will be a key factor limiting the extent of house price gains next year (we forecast a 7% lift).
- Scenario analysis highlights the difficulty in returning affordability to pre-COVID levels.
That the housing market has turned a corner is increasingly old news. National house prices stopped falling in March, according to the monthly REINZ House Price Index (seasonally adjusted). Over the past three months that we have data for (May-July) we’ve seen consecutive increases.
The odds are that this tentative uptrend will be sustained, in some shape or form. When housing momentum turns, it tends to stay turned. Back in early June, we forecast a 3% lift in house prices over the second half of this year, followed by a 7% lift through next year. We’ve seen nothing in the run of play since to throw us off this view.
But what does the turning in the house price cycle mean for the affordability outlook? Late last year we suggested housing affordability was poised to recover through 2023. This was based on a new index we compiled that drew the key affordability threads together. We thought it was a good time to have another look at it.
Up, down, and sideways
The crux of the index is that, of the long list of factors affecting housing affordability, there are three core components: the size of the required deposit, the cash required to service a mortgage, and the household incomes used to pay these bills. These factors often move at different rates and in different directions (chart opposite).
By combining them and adding in some forecasts, we can get a rough steer on the likely future direction of affordability trends. It is just a rough steer – our index only gets at ‘the average’ and the reality is that any particular situation could be different.
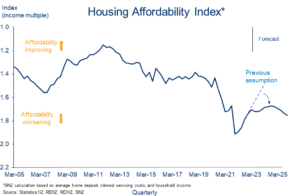
You can interpret the index as the average cost of a deposit and the first year of debt servicing payments, expressed as a multiple of the average household disposable income.[1] It looks like this:
Sideways
We can draw the following conclusions:
- Housing affordability has continued to improve (become less bad). Our index is up around 10% from ‘peak unaffordability’ in December 2021 (1.7 times average income compared to 1.9 times in December). Most of this reflects the fall in house prices over that time. Strong income growth has helped too, with higher debt servicing costs working in the other direction.
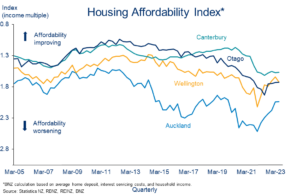
- Auckland has experienced the largest affordability recovery (chart below) but unsurprisingly remains the most unaffordable market overall. Canterbury has changed little thanks to an outperforming housing market while Otago has the dubious honour of now matching Wellington in the unaffordability stakes (having surpassed Canterbury in 2017).
Regional Convergence
- Our prior expectations of continued improvement in housing affordability have been flattened. Not completely, but based on our projections for income growth, house prices, and mortgage rates, the speed of any improvement over 2024 looks glacial (see chart on page 1). Firmer house price expectations, and hence higher deposit requirements, have done most of the damage here relative to our last affordability update in December.
Our expectations of strong, but slowing, household income growth and some mortgage rate relief are enough to hold back the higher house price tide over 2024, but 2025 is a different story and affordability starts to deteriorate again. We’re quick to reiterate here that all of this is very sensitive to our forecasts, particularly those for house prices which, as we all know, are very tough to get right.
Given this uncertainty, it’s worth looking at a few scenarios. In the chart below, we’ve changed one or two of the forecast variables in each scenario and left all else constant.
Choose your adventure

In the first, a situation in which house prices grow at double our expectations through calendar 2024 (+14%) pulls affordability back down to near the December 2021 lows.
In the second, a scenario in which the Reserve Bank delivers early 2024 interest rate cuts provides a small boost to affordability, relative to our ‘central’ assumption. But it’s small bikkies in the grand scheme.
Finally, in a possible but unlikely ‘goldilocks’ scenario in which household income growth holds at a healthy 7% and house prices flat-line for the next two years, our affordability index roars back up to above pre-COVID levels. It highlights, again, how difficult it is to claw back affordability in the wake of a house price boom.
Stretched affordability will be a key factor limiting the extent of house price gains next year (we forecast a 7% lift). Still-high mortgage rates and a slackening labour market are the other factors expected to keep a lid on things.
To finish, and if you’ve got a sec, let me know what you’re interested in hearing about in future here.
Subscribe to Mike’s updates here
[1] In practice, we assume a deposit of 20% of the median national house price. To this we add debt servicing costs in the first year (i.e. interest only), based on an 80% LVR and a 50/50 mix of floating and 2-year fixed mortgage rates, all expressed as a multiple of the average household disposable income. Technically, the discounted value of future debt servicing costs should be included, but we’ve simplified for ease of interpretation.
Disclaimer: This publication has been produced by Bank of New Zealand (BNZ). This publication accurately reflects the personal views of the author about the subject matters discussed, and is based upon sources reasonably believed to be reliable and accurate. The views of the author do not necessarily reflect the views of BNZ. No part of the compensation of the author was, is, or will be, directly or indirectly, related to any specific recommendations or views expressed. The information in this publication is solely for information purposes and is not intended to be financial advice. If you need help, please contact BNZ or your financial adviser. Any statements as to past performance do not represent future performance, and no statements as to future matters are guaranteed to be accurate or reliable. To the maximum extent permissible by law, neither BNZ nor any person involved in this publication accepts any liability for any loss or damage whatsoever which may directly or indirectly result from any, opinion, information, representation or omission, whether negligent or otherwise, contained in this publication.