Just a little patience
9 Feb 2024
- Summer economic data flow far from sunny
- But progress on inflation continues
- Enough to hold our view of an August cash rate cut, and second half mortgage rate downtrend
- Offshore central banks rubber stamping earlier cuts
- We retain our overall housing market view but tweak our 2024 house price inflation forecast to 5% (from 7%)
Here are seven things we’ve learned about the economy over the summer holiday period.
1. It’s still hard to find a pulse in current economic data
The economy continues to slide into the tough part of the cycle. From what we’ve seen over the past few weeks, it looks as if the economy gently reversed into 2024.
December’s 2% fall in retail card spending figures meant that the level of spending finished 2023 below where it started. And that’s despite a near 5% lift in prices over the year and an extra 140,000 people in the country.
We also received news the previously sturdy services sector finally succumbed. The Performance of Services index (PSI) dipped back into recessionary territory in December, a place its compatriot the Performance of Manufacturing index (PMI) has been since February of last year. The combination of the two plays to the grain of our view GDP will continue to contract in the short-term (chart below).
Stalled

2. Pessimism about the future quietly reducing
If conditions in the here and now remain difficult, there are still signs a turning point is withing reach. The discrepancy between what’s going on now and what people expect 6-12 months down the line is widening.
The forward-looking growth gauges from the latest batch of business confidence surveys have now climbed to levels that can no longer be waved away as entirely election-related.
Even if we don’t believe all the recent lifts – which at face value imply GDP growth of 2-3% – there’s plenty of fodder for the view the economy will grind back into gear over the second half of this year.
Hope springs

3. Labour market now oversupplied
Pulling the various threads of recent labour market information together yields a picture in which:
- a) Jobs growth is continuing – employment growth is chugging along at 2-3% p.a depending on which measure you look at;
- b) Firms says they broadly intend to keep up this pace of hiring. Surveyed employment intentions are consistent with roughly trend jobs growth; and
- c) Slack in the labour market is nevertheless appearing, and the unemployment rate looks destined to rise sharply towards 5½% this year. That’s from the 4.0% rate it ended 2023, as reported by Stats NZ yesterday.
At the root of all this is the migration-driven explosion in the supply of available workers. The indications are that this wave of supply is increasingly overcoming firms’ demand for additional labour. See for example the labour availability metrics in the chart below. It’s a remarkable turnaround from the extreme labour market tightness and excess demand of only a year ago.
Unemployment set to rise towards 5%

The latest (November) migration figures presented a clearer picture of migration peaking around current annual (net) inflows of 130,000. But the conditions for a sharp slowing in wage growth this year are already in place. We’re seeing this slowly turning up in the data. For example yesterday’s Q4 labour market report showed average hourly earnings growth cool to 6.3% y/y, down from the 2022 peak of 8.5%.
4, More progress on inflation
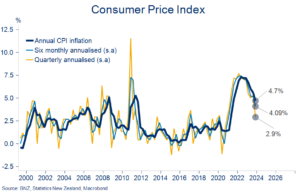
The good news is that annual CPI inflation is falling and the indicators suggest it will continue to do so. It finished 2023 at 4.7% and we see it back within the Reserve Bank’s 1-3% target range by September of this year.
Annualised measures of inflation can be useful (in moderation) for getting a more current, if volatile, read on inflation pressure. They support the idea it’s dissipating.
Choose your poison
The not-so-good news is that the debate about whether sticky domestic inflation will stymie or reverse this process is far from settled.
Indicators on this front are still mixed. Firms’ pricing intentions, particularly those for service industries in which labour is the dominant cost, suggest the inflation decline may yet get stuck around 4%.
The recent lift in shipping costs and supply chain pressure also can’t be ignored although, relative to the 2021 snarl ups, weaker demand this time around should dull the pass through to end prices.
Our contention is that a rapidly easing labour market and the usual lags involved in higher interest rates will eventually put paid to lofty services inflation. But the RBNZ is clearly not so sure and wants to see the hard evidence before changing its tune.
5. Confirmation offshore interest rate declines are coming
Central banks in the US, Europe, and the UK have all been out in the past few weeks basically rubber-stamping expectations for cuts in interest rates later this year. That message has of course been enthusiastically received by global equity markets.
There’s still debate about when and how much. Markets, as ever, want sooner. Central bankers are urging patience. The US Federal Reserve appears to be guiding expectations towards May/June, from the March start markets had been eyeing up until last week. Traders price Europe to go first in April, the UK in May, and then for NZ to follow in July/August.
Big cuts in offshore rates, NZ to lag
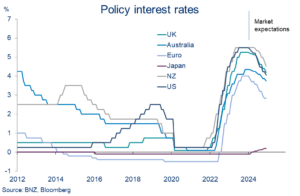
Whatever the exact start date(s), the fact that inflation in the big, developed economies is back down around target levels, growth/employment indicators are looking wobbly, and yet interest rates remain up at deeply taxing levels means significant easing is very likely this year.
The implications for us are, first, some downward pressure on our wholesale, and hence potentially retail, interest rates. Particularly at the longer-terms at which offshore factors tend to hold more sway. Second, upward pressure on the exchange rate unless the Reserve Bank also starts cutting, which it won’t, at least initially.
6. Housing recovery hits a speed bump, forecast tweaked
We haven’t changed our housing view in the wake of the Reserve Bank’s recent proposal to activate debt-to-income (DTI) ratios mid-year.[1]
The introduction of DTIs was well signposted and they’re proposed to be set at levels that won’t be immediately binding (our Property Pulse has a more detailed explainer). The design is such that DTIs will become binding when property market conditions become frothy, but have little impact during ‘peace time’. Think of it as setting a speed limit of 100 km/h when the traffic is going 60 km/h.
For now, servicing requirements – courtesy of high mortgage rates – remain the biggest constraint on prospective borrowers.
[1] Debt-to-income ratio threshold of 6 proposed for owner-occupiers and 7 for investors, both with a 20% speed limit. Newly constructed dwellings and Kāinga Ora loans exempted.
Proposed DTI limits long way from binding

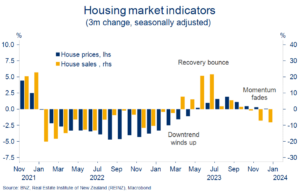
What has led to a modest tweak to our view is the continued drip of sub-par housing market information.
It’s become clear that the recovery has lost momentum. Having lifted 2½% from April to August, the REINZ House Price Index has essentially flat-lined over the subsequent four months. Properties are also taking a little longer to sell relative to mid-year and sales activity is still sub-par.
It’s not that the recovery is over, more that it’s taking longer to get out of first gear. Some of this may reflect the late 2023 round of mortgage rate increases, but it also appears that the lift in supply we flagged last year is comfortably absorbing any extra demand.
We now expect a flat first quarter for house prices. This lowers our calendar year house price inflation forecast to 5%, from 7%. It’s rounding error stuff in the grand scheme of house price uncertainty but better encapsulates the balance of risks as we see them.
Recovery in house sales/prices loses steam
The rest of our profile is unchanged. We continue to expect booming population growth, falling construction activity, and eventual mortgage rate cuts to deliver a sustained uptrend in house prices. At the margin, we can add to this list of supportive factors the Reserve Bank’s proposed easing in loan-to-value restrictions (LVR) slated for later this year.[1]
7, Lower interest rates still likely (later) this year
The year has started with a few small adjustments to mortgage rates. We’d describe these more as tweaks than the start of any sort of downtrend.
Any reductions have also been more in the longer terms in which there seems to be little interest at the moment. RBNZ data show borrowers overwhelmingly favour shorter fixed terms, predominantly one-year. Fixing for terms of 18 months or less accounted for 68% of all mortgage lending as of November. The share has probably increased since then.
Based on our general interest rate view, we have little reason to quibble with this preference for shorter fixed terms. Rapidly falling inflation, an economy out for the count, a slackening labour market, and a housing market that so far hasn’t lived up to fears of resurgence still suggest to us that the Reserve Bank can lower the Official Cash Rate (OCR) later this year.
We remain comfortable with our forecast for an August start. If the wheels really fall off it could be sooner or, conversely, if the Reserve Bank wants to wait for hard evidence inflation is dead and buried it will come later.
But holding the line on our third quarter rate cut view means we continue to believe mortgage rates have peaked and are likely to fall this year. Once again, we’re quick to add that trend declines are a story for the second half:
- we don’t think wholesale rates will keep falling at the rate they have been;
- term deposit rates (the major component of bank funding costs) have yet to fall at all;
- Reserve Bank rhetoric continues to pile up on the ‘higher-for-longer’ side of the debate.

[1] It is proposed that the >80% LVR ‘speed limit’ for owner-occupiers will be increased from 15% to 20%, and the investor >65% threshold be increased to >70%, with an unchanged (5%) speed limit.
Subscribe to Mike’s updates here
——————————————————————————————————————————————————————–
Disclaimer: This publication has been produced by Bank of New Zealand (BNZ). This publication accurately reflects the personal views of the author about the subject matters discussed, and is based upon sources reasonably believed to be reliable and accurate. The views of the author do not necessarily reflect the views of BNZ. No part of the compensation of the author was, is, or will be, directly or indirectly, related to any specific recommendations or views expressed. The information in this publication is solely for information purposes and is not intended to be financial advice. If you need help, please contact BNZ or your financial adviser. Any statements as to past performance do not represent future performance, and no statements as to future matters are guaranteed to be accurate or reliable. To the maximum extent permissible by law, neither BNZ nor any person involved in this publication accepts any liability for any loss or damage whatsoever which may directly or indirectly result from any, opinion, information, representation or omission, whether negligent or otherwise, contained in this publication.