Property Pulse: stuck in the slow lane
23 May 2024
- Stodgy housing market momentum to stick around
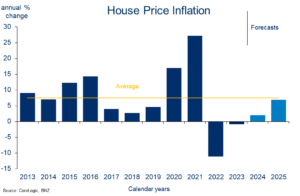
- We lower our house price inflation forecasts
- Clearer upswing not expected until next year
- Expected timing of first cash rate cut pushed back to February, from November
Welcome to our second Property Pulse for 2024. Supporting our more regular EcoPulse updates, the aim here is to chat through recent housing and mortgage rate happenings, and provide our take on the outlook.
BNZ house price forecasts
Impact of macro drivers of our house price view
The table below summarises the various drivers of house price inflation and their directional impact on our view.

False start
Top-line indicators of NZ’s housing market continue to depict a market that’s plodding at best.
After a string of monthly house price increases through the latter stages of last year, the tentative upswing has run out of puff. The latest slug of REINZ housing data showed the House Price index recording essentially no growth from January to April (adjusted for seasonality). That leaves house prices holding about 3% above the February 2023 cycle low.
Momentum fades

There have been more signs of life in housing turnover. Monthly house sales are still tracking below average but, at around 6000 per month, are now about 40% above early 2023 levels.
First home buyers making hay, investors MIA
A lift in interest amongst first home buyers (FHB) remains a feature of this extra housing activity. The share of new mortgage lending attributed to FHB has been running at a historically elevated 24% of the total for almost year now (chart below).
First home buyers most active
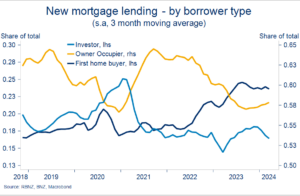
Investors, by contrast, are less interested. New investor lending diverged noticeably from that of FHB in 2022 and has tracked down to about 16% of total. In absolute terms, it has yet to substantively recover from the lows struck around the start of 2023.
Any positive impact on investor demand from the new government’s change in investor tax policies, so far, seems to be being offset by the cash flow hit from high interest rates and soaring insurance, rates, and maintenance bills. The anecdote points to investors remaining on the sidelines in the short-term. It’s possible we see a lift in investor selling intentions once the Brightline Test shifts back to two years in July, but we’d expect this impact to be small.
House sales trending higher
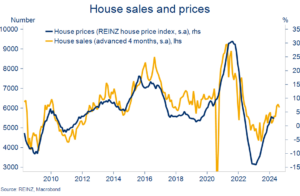
Ordinarily, the shift up in sales activity would be a reliable indicator that house price appreciation is to follow (chart above). This may come through at some stage, but in the short-term we’re not convinced.
Listings > sales
That’s because new listings continue to rise even faster than sales. There’s excess supply, in other words. Unsold inventory increased again in April to a fresh seven year high (s.a.). The extra choice and time available to buyers –median days to sell a property are well above average – are not the sort of conditions to squeeze house prices higher.
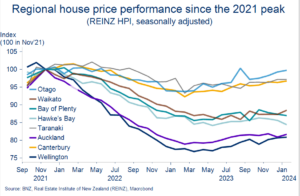
Indicative of such, we note that those regions that have experienced the largest lift in inventory since January – namely Auckland (+15%) and Wellington (+22%) – have been relative underperformers in the house price stakes (chart below).
Inner city pressure
Duck on a pond
Stepping back out of the weeds, the current status of the housing market brings to mind the duck on the pond analogy. Calm and largely static on top of the water, but with lots of countervailing forces colliding below the surface.
Stacking up house price fundamentals, first on the supportive side, we have:
- Booming population growth. In the year to March, the population grew by 131,000 (that’s two Napiers). Buoyant net migration inflows and rent inflation for new tenancies are now slowing, but they remain at levels indicative of heightened pressure on housing resources.
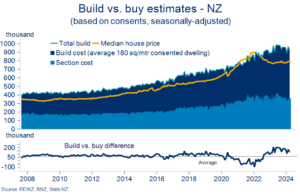
- High build costs. It’s still much more expensive to build a new home than it is to buy an existing one, at least on our numbers. Since we first wrote on the topic our estimate of the gap has reduced a little. But it’s still well above average, meaning marginal housing demand will be directed relatively more into the existing market.
Build costs > Buy costs
- Housing policies are tilting more supportive. Interest deductibility is now back to 80% and will go to 100% next year, the Reserve Bank has flagged an easing in loan-to-value ratio requirements later this year, and proposed debt-to-income ratios won’t be immediately binding. The winding back of the Brightline Test to two years from ten could support investor demand at the margin, but some investors may also be more willing to sell once it is shortened up. We’ve assumed a neutral impact.
On the negative side:
- Cash flow crunch. Mortgage rates are going to stay high all year, and the process of adjustment to past increases continues. The average paid mortgage rate has lifted to 6.1% and will rise a further 0.5% or so from here. Insurance, rates, and maintenance costs have soared.
- Economic sentiment is in the doldrums and probably won’t improve substantively until next year. We don’t see economic growth resuming until the third quarter of this year at the earliest (chart opposite).
Cycle links being restored

- Labour market conditions are deteriorating. The unemployment rate has risen to 4.3% on its way to a 5.5% forecast next year. Reduced job security, wage growth, and general job opportunities are impinging upon housing demand and this trend has further to run. Mortgage arrears and stress metrics are still low in historical terms, but will deteriorate further before they improve.
The final tally
Weighing up the balance of the above, house price fundamentals are overall less supportive than at the time of our last update. Economic and labour market conditions have deteriorated, mortgage rates are set to stay higher for longer, and the jump in unsold inventory will take time to work off. We’ve shaved back our 2024 house price inflation expectations as a consequence.
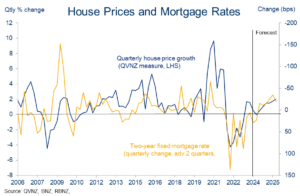
Further ahead, we remain of the view the current period of house price stasis will eventually give way to a clearer upswing in prices. Most important in this regard is our view that mortgage rates will start trending lower next year (chart below and next section). More demand-friendly housing policies and a recovering economy will add support. Acting in the other direction, affordability and cash flow constraints will cap the magnitude of the upturn.
Trend change in 2025
Mortgage rate outlook

Floating rates – holding pattern
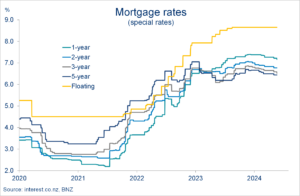
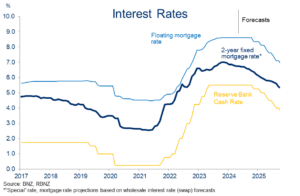
Floating rates have barely moved in almost a year (chart below). There’s little prospect of this changing in the short-term.
In the wake of the Reserve Bank’s (RBNZ) higher-for-longer messaging, we’ve pushed back the expected timing of the first cash rate cut to February (from November). If this pans out, floating rates could be expected to start falling around the same time. But meaningful falls from current levels around 8.5% back towards 7% and beyond will have to wait until the second half of 2025.
The deteriorating economic backdrop and slow-but-steady progress on inflation mean we continue to believe the cash rate can be lowered earlier than RBNZ forecasts imply (now late 2025). Our best guess on the timing is February 2025, but significant uncertainty remains.
Holding pattern
Fixed rates – also holding pattern
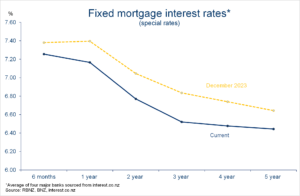
Fixed mortgage rates look to have peaked in December. They’ve since pulled back a small 15-30bps, depending on which term you look at (chart opposite).
December high water mark
For some time, our mortgage interest rate view has trod a relatively unexciting middle ground between calls for higher interest rates and speculation of imminent sharp declines. In essence, this sideways-to-mildly-lower view of fixed mortgage rates remains. It reflects a combination of:
- A gradual downtrend in wholesale interest rates.
We suspect wholesale interest rate markets will continue to price in early RBNZ rate cuts, despite this week’s higher-for-longer messaging from the Bank. Particularly if the flow of incoming economic data remains on the softer side, as we expect.
Cash rate cuts from February
- Rising bank funding costs blunting some of the impact of lower wholesale rates on mortgage rates. Rates on term deposits (the bulk of bank funding) have yet to fall to any significant degree and older, low cost bank funding continues to roll off.
Fix or float?
Before diving into the fixing debate, it’s worth reiterating that getting a mortgage strategy “right” is more about meeting a borrower’s financial needs and requirements for certainty, than trying to pick the next rate move. The latter is fraught with difficulty.
Mortgage rates at all terms are ever so slightly lower than at the time of our last update. But the essence of the mortgage term decision hasn’t changed. Six-month and one-year fixed rates remain 50-80bps above longer-term two-and three-year rates. In other words, the mortgage curve remains “inverted”. Fixing for shorter terms, at higher rates, can thus be thought of as ‘buying’ the option to roll onto lower rates in future, should they transpire.
Average mortgage lending term reducing
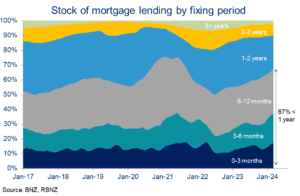
Doing so remains overwhelmingly popular. In February and March (the latter being the latest we have RBNZ data for), three quarters of all new mortgage lending was done at terms of one year or less. The stock of all existing mortgage borrowing is similarly tilted, with 67% by value having a term to maturity of one year or less (chart opposite).
In short, the majority of borrowers are positioned for mortgage rates to fall. For new or refinancing borrowers, the question is how far do interest rates need to fall in future to make paying more for shorter-term fixes worthwhile? ‘Breakeven’ analysis can be useful in this regard.
It’s easiest to consider an example. It’s currently possible to fix for two years at around 6.75%.[1] Alternatively you could fix for one-year at around 7.15% and then, assuming rates do fall, roll onto a lower one-year rate in a year’s time. Based on market pricing, to breakeven on the rolling shorter-term strategy relative to the two-year strategy, the one-year rate needs to be about 0.8 percentage points lower in a year’s time (around 6.35%).
On the face of it, our interest rate view and forecasts suggest there’s a good chance of that scenario playing out. All else being equal, that indicates there may be value in fixing for a shorter term like the one-year.
That option also provides less certainty about future payments though, and there’s still plenty of interest rate uncertainty around. There may thus be value for some borrowers to spread some of their risk out into the longer 18-month and two-year terms. Interest rates at those terms are also a little lower.
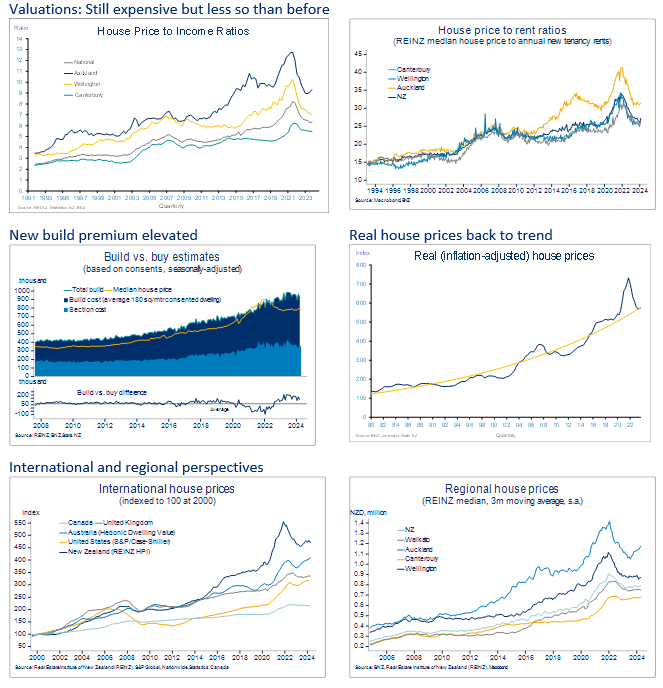
Appendix 1: Valuation chart-pack
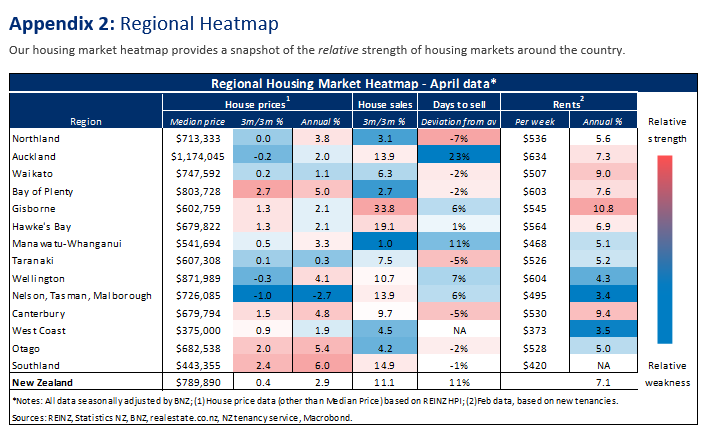
Appendix 2: Regional Heatmap
Our housing market heatmap provides a snapshot of the relative strength of housing markets around the country.
[1] Average of ‘big four’ bank “special rates”, sourced from interest.co.nz
To subscribe to Mike’s updates click here
Disclaimer: This publication has been produced by Bank of New Zealand (BNZ). This publication accurately reflects the personal views of the author about the subject matters discussed, and is based upon sources reasonably believed to be reliable and accurate. The views of the author do not necessarily reflect the views of BNZ. No part of the compensation of the author was, is, or will be, directly or indirectly, related to any specific recommendations or views expressed. The information in this publication is solely for information purposes and is not intended to be financial advice. If you need help, please contact BNZ or your financial adviser. Any statements as to past performance do not represent future performance, and no statements as to future matters are guaranteed to be accurate or reliable. To the maximum extent permissible by law, neither BNZ nor any person involved in this publication accepts any liability for any loss or damage whatsoever which may directly or indirectly result from any, opinion, information, representation or omission, whether negligent or otherwise, contained in this publication.


