Property Pulse: Shifting back into neutral
12 Mar 2024
- Crosswinds in housing demand are cancelling each other out, even as new listings soar
- It’s not a recipe for higher house prices, and we expect a flattish first half
- Momentum expected to pick up later in the year
- Recent small falls in mortgage rates may extend, but a downtrend still looks like a story for late 2024
The view, in brief
We expect about a 5% lift in house prices this year. That’s a touch lower relative to last time. We’ve also backloaded those gains into the second half of the year.
We don’t see a lot of action over the first half. High mortgage rates and stretched affordability are restraining demand, essentially nullifying the demographic and policy tailwinds blowing in the market’s favour. Against this backdrop, the market is struggling to absorb a flood of new listings. Unsold inventory is at 7-year highs.
We expect this chill in housing market activity to thaw as we move into the second half of the year. New home construction looks set to undershoot population requirements, and we’d also expect a boost to demand from likely lower mortgage rates. On the latter, the recent Reserve Bank meeting left us comfortable with our view for interest rates to go no higher, and for cuts to begin later this year.
Welcome to our first Property Pulse for 2024. Supporting our more regular EcoPulse updates, the idea here is to take a more detailed look at all things housing. We also dip into mortgage rate dynamics.
Included in report:
- The view, in brief
- House price outlook
- Mortgage rate outlook
- Appendix 1: Valuation chart-pack
- Appendix 2: Regional Heatmap
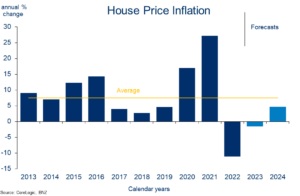
BNZ house price forecasts
Impact of macro drivers of our house price view
The table below summarises the various drivers of house price inflation and their impact on our view.
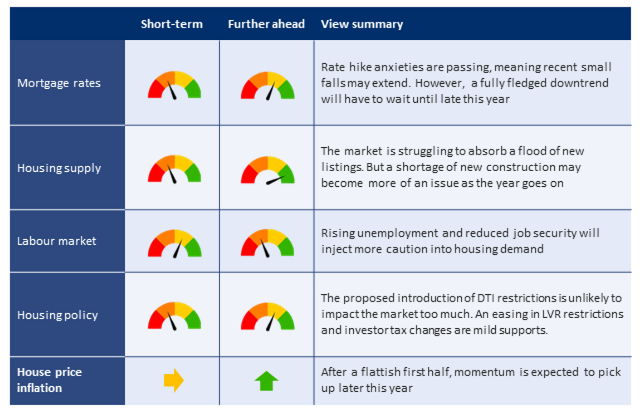
There’s a bunch of big macro factors colliding inside NZ’s housing market. And the net result is…not much. Rather than kicking on, the recovery in house prices and sales that began in the middle of last year is showing signs of petering out.
National house prices are rising but, consistent with our expectations, it’s more grind than roar. The REINZ HPI, our preferred house price measure, is up 1.8% over the past six months. Prices are a little over 3% above the April 2023 cycle low (all figures seasonally adjusted).
Activity indicators like the volume of house sales and days to sell a house depict a market that’s plodding at best. These measures usually provide a decent steer on where house prices go in the short-term. At current levels, they suggest prices will continue to list sideways, at best, over the next few months.
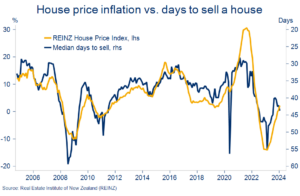
Days to sell lengthening
The pace of monthly sales has throttled back to around 5000/month, from closer to 6000 in the spring (all s.a.). That’s about 20% below the long-run average. The time it takes to sell the median house has also lengthened back out to 44 days, having fallen to 40 days six months ago. The long-run average is 38 (all s.a.).
Demand crosswinds cancel out
It looks to us like the large demographic tailwind blowing in the housing market’s favour – the strongest population expansion in 76 years – is colliding with high mortgage rates and resulting in only a trickle of extra demand. Consistent with this, new housing lending growth remains very subdued.
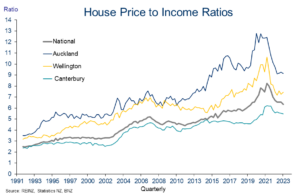
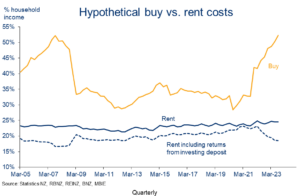
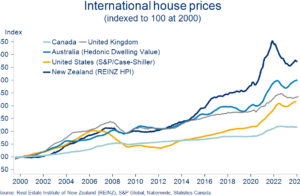
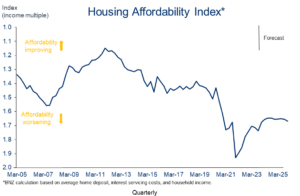
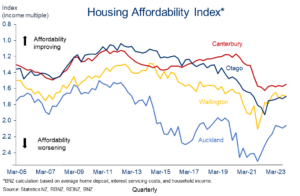
Let’s not forget also that, while we all talk in percentage terms when it comes to the housing market, affordability, which is about the level of house prices, is still highly stretched (see charts in appendix). Despite the correction from 2021 peaks, house prices are almost 25% higher than pre-COVID levels. In some parts of the country – notably the South Island – they’ve barely fallen at all.
Listings soar
Alongside patchy demand, the other factor that’s keeping a lid on house prices is a flood of new listings. Anecdotal reports about this wave of supply have been circulating for a while, but it’s now washing up in the data.
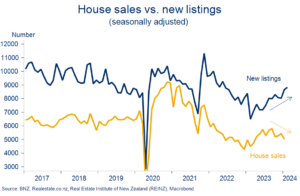
Listings outpacing sales
February numbers from realestate.co.nz showed the new listings run-rate continuing to push well above that of sales. That’s even when we adjust the data for the usual seasonal flush this time of year. This shortfall of sales relative to listings has seen the amount of unsold inventory sitting on the market float up to the highest level since 2017. It’s hardly a recipe for higher prices.
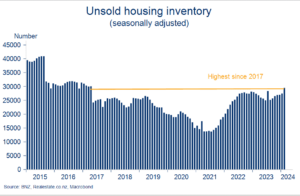
Inventory jumps
Momentum to lift after flat first half
Looking ahead, high mortgage rates are likely to stick around for at least another six months, reinforcing the dynamics above. There’s also the long tail of existing mortgage holders continuing to roll onto higher fixed mortgage rates, something that will also keep a lid on housing market enthusiasm.
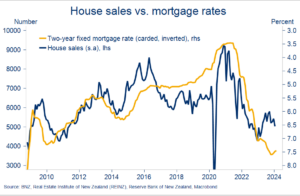
Mortgage rates restraining housing activity
As a result, and as recently flagged, we now expect a flattish first half of the year for house prices.
But as we move through into the second half of the year upward momentum is expected to resume:
- Our view that the Reserve Bank will start lowering the Official Cash Rate late this year hasn’t changed through the recent round of rate hike anxiety. Mortgage rates are thus still expected to start trending lower towards the end of the year (see mortgage rate section).
- Pressures arising from record population growth will increasingly seep into the housing market. This pressure is already clearly evident in the near 10% jump in (new tenancy) rents in parts of the country. Over time, those renters that have saved a deposit may choose to exit that market and buy, and there’s also likely to be some extra demand from non-NZ citizens that become eligible to purchase a house, for example by having been here for 12 months.
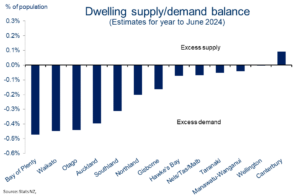
Bay of ‘Plenty’ coming up short
- Residential construction is falling, potentially aggressively, meaning new housing supply will likely fall short of population requirements this year. Our recent note estimated this new supply imbalance will be most obvious in the Bay of Plenty, Waikato, Otago, and Auckland.
- Tempering these housing supports is the less robust labour market. Rising unemployment, reduced job security, and fewer labour market opportunities generally already appears to be injecting more caution into housing demand.
So, in sum, after a flattish first half, house prices are expected to rise modestly over the second half of this year. Our overall calendar year forecast of 5% remains unchanged, but the expected gains are now backloaded into the second half.
Usual house price forecasting caveats apply here – there’s always more confidence about what is happening now relative to any sort of forecast.
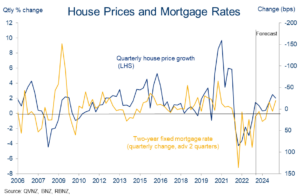
Trend change late in the year
Mortgage rate outlook
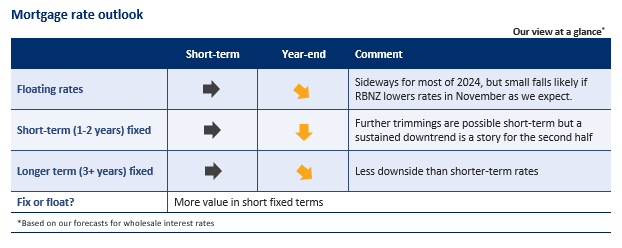
Floating rates – sideways
For almost twelve months we’ve maintained the view that the Reserve Bank’s cash rate, and hence floating mortgage rates, were unlikely to move higher. Speculation of additional rate hikes flared up occasionally, and aggressively so in recent times. But that speculation has now fully unwound and, given the dour flow of economic news, we doubt it will return.
The economy remains in a rolling recession, labour market tightness is a thing of the past, and inflation is falling rapidly and forecast to be back in the Reserve Bank’s 1-3% target range later this year. To us, this mix of conditions points to a need for lower interest rates in time. The missing ingredient is a bit more progress on (core and headline) inflation continuing to fall.
Taking all this into account, our best guess is that the Reserve Bank will be able to lower the cash rate from November. We reckon the risks are roughly balanced either side of this. In other words, it could just as easily be earlier as later. But should our November forecast pan out, floating mortgage rates would be expected to end 2024 a little lower than currently, with chunkier falls in 2025.
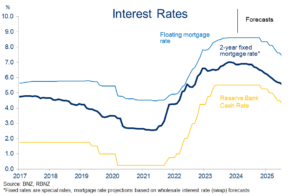
Next move is down
Fixed rates – gently lower
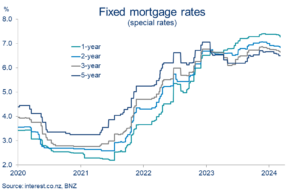
We’ve seen a few small cuts in fixed mortgage rates over the past few weeks. But, stepping back, the bigger picture is one of fixed rates consolidating broadly sideways for the past 12 months.
Sideways consolidation
We wouldn’t be surprised to see further small falls in the short-term. Wholesale interest rates have bounced around a lot recently given the divergent speculation about what the Reserve Bank might do. But smoothing through it all there’s been a gentle downtrend evident which we think will be maintained.
This downtrend won’t be consistent or aggressive given the Reserve Bank’s vigilance around keeping interest rates elevated for some time (till early 2025 on their forecasts). But the (arguable) removal of rate hike risks and expected accumulation of weak economic news from here paves the way for wholesale rates to drift lower as we go through the year and rate cuts drift into view.
We continue to expect rising bank funding costs to blunt some of the impact of lower wholesale rates on mortgage rates. Rates on term deposits (the bulk of bank funding) have yet to fall to any significant degree. And funding pressures will stick around as cheaper, COVID-era bank funding rolls off to be replaced with higher cost funding instruments.
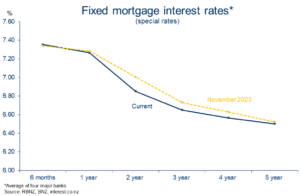
Mortgage curve still “inversely” sloped
Fix or float?
Before diving into the rate fixing debate, it’s worth reiterating that getting a mortgage strategy “right” is more about meeting a borrower’s financial needs and requirements for certainty, than trying to pick the next rate move. As we have seen, the latter is fraught with difficulty.
The current “menu” of mortgage rates and terms remains much as it was in our last edition (chart above). In short, the longer the fixing term, the lower the rate. This “inversion” of the mortgage curve reflects the same in wholesale rates.
Despite the higher interest rates associated with shorter fixed terms, there’s still been a clamour to ‘go short’. Reserve Bank data show the share of new mortgage lending at terms of 18 months or shorter (including floating) has trended up from a 51% low at the end of 2022 to a new high of 77% in January (chart below).
That’s interesting as it shows:
- There’s now a higher than usual sensitivity of mortgage-holders to changes in interest rates over the coming 12 months.
- Borrowers are not just opting for the lowest available rate, as has often been the case. It seems to be more a case of paying a little more now to have the option to roll onto potentially lower rates in future.
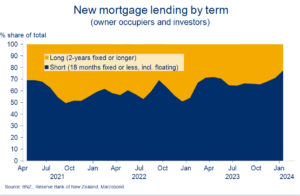
Clamour for shorter terms
So how much do interest rates need to fall to make this strategy of paying a higher rate to go short worthwhile?
Consider an example. It’s possible to fix for 2-years now at around 6.80%.[1] Alternatively you could fix for one-year at around 7.25% and then, assuming rates do fall, roll onto a lower one-year rate in a year’s time. To ‘break-even’ on the shorter-term strategy, the one-year rate in a year’s time needs to be about one percentage point lower (so around 6.30%) based on current market pricing.
On the face of it, our interest rate view and forecasts suggest there’s a good chance of that scenario playing out. All else being equal, that suggests there may be value in fixing for a short-term like the one-year.
That option also provides less certainty about future payments though and, even though we see less risk of interest rates going higher, forecasts don’t always go to plan. Hence there may also be value for some borrowers in looking at slightly longer fixing terms, rates for which have fallen a bit further recently.
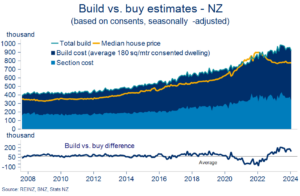
Appendix 1: Valuation chart-pack
Valuations slowly easing
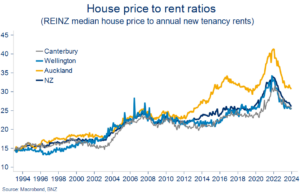
Buy or build? Rent or buy?
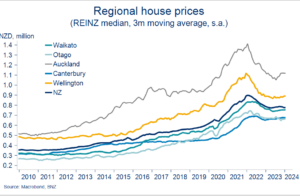
International and regional comparisons
Trend affordability improvement flattens
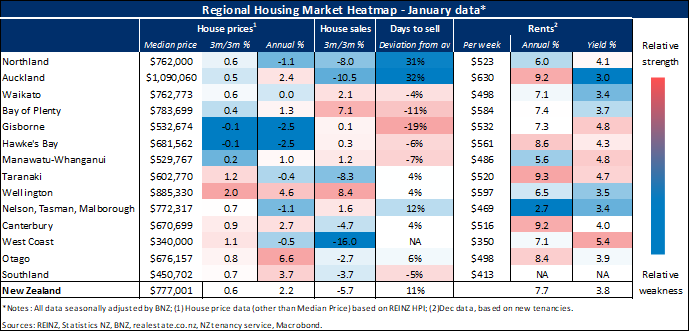
Appendix 2: Regional Heatmap
Our housing market heatmap provides a snapshot of the relative strength of housing markets around the country.
[1] All rates quoted here sourced from interest.co.nz and are “special” rates i.e. LVR<80%
To subscribe to Mike’s updates click here
Disclaimer: This publication has been produced by Bank of New Zealand (BNZ). This publication accurately reflects the personal views of the author about the subject matters discussed, and is based upon sources reasonably believed to be reliable and accurate. The views of the author do not necessarily reflect the views of BNZ. No part of the compensation of the author was, is, or will be, directly or indirectly, related to any specific recommendations or views expressed. The information in this publication is solely for information purposes and is not intended to be financial advice. If you need help, please contact BNZ or your financial adviser. Any statements as to past performance do not represent future performance, and no statements as to future matters are guaranteed to be accurate or reliable. To the maximum extent permissible by law, neither BNZ nor any person involved in this publication accepts any liability for any loss or damage whatsoever which may directly or indirectly result from any, opinion, information, representation or omission, whether negligent or otherwise, contained in this publication.