Looking up, from a deeper hole
9 Sep 2024- Eco news turns less negative
- Fundamental downforces lifting, but way ahead still a trudge
- Overall, more evidence economy around ‘peak bad’
- Interest rates keep falling, no change to our views
- What do falling mortgage rates and higher house prices mean for housing affordability?
Over the past few weeks we’ve watched most of the July eco-news roll in.
The good news is that, in nearly all cases, July readings improved from frankly terrible June results. The less good news is that, despite this, most of these indicators remain at subpar levels indicative of an economy going backwards.
For the full picture, the chart below indexes most of the key monthly (“high frequency”) indicators so they can all be summarised on the one chart.
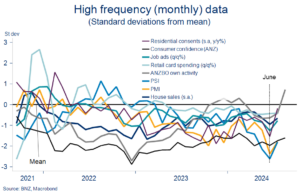
There’s a strong ‘dead cat bounce’ element in the mix. That is, June was so weak and/or holiday-affected that some relief was always likely for the following month. We’d put consents, card spending, the PMI, the PSI, job ads, and house sales in this category.
Nonetheless, the less-bad vibe in the data flow must still be taken as an encouraging sign given the disconcerting speed with which everything had been deteriorating since about February.
Moreover, some abatement in the two big fundamental downforces on the economy raises the odds we get a bit more relief in the numbers over coming months.
- First and most obviously, interest rates are coming down. It’s too early for this to have had much of an impact to date but it undoubtedly did on the most forward-looking of the indicators opposite – own activity expectations from the ANZ business survey. They’re now above average. The extent of the jump has raised a few eyebrows, but it was still interesting to see the retail sector experience the largest increase (albeit from the lowest base). That lines up with a few other snippets suggesting the retreat in retail spending may be nearing its end.
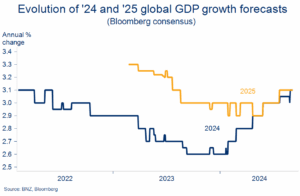
- Second, and perhaps less obviously, expectations of a global cyclical upturn are hanging in there. That’s despite few signs China’s economy is about to right itself and fading hopes US economic ‘exceptionalism’ can be maintained. Instead, forecasters are putting their faith in other parts of the world – Europe particularly – to pick up some of the slack next year. Falling global interest rates are the big support here, and we note global GDP growth forecasts for this year and next are still clawing their way higher. They’re now almost back to trend sorts of levels.
The latter point signals a more supportive demand backdrop for our primary exports in future. That’s encouraging given still challenging conditions in the rural sector. It would be a stretch to say firmer global demand is the main factor behind recent lifts in meat and dairy prices – they’ve been far more about tightening supply – but it has certainly helped.
Beef and lamb prices have increased 15-20% over the past four months, albeit in the case of the lamb to still very low levels. Dairy auction prices have maintained a wobbly uptrend and are now up 35% on a year ago. That’s allowed us to lift our 2024/25 Fonterra Milk Price forecast to $8.50 kg/ms. Relative to a $8.00 counterfactual, that would amount to an extra almost $1b in dairy sector income.
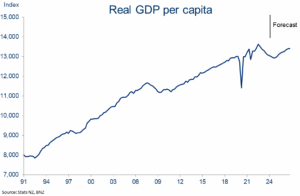
Combined, the ok-looking global backdrop, falling interest rates, and stabilising economic data flow broadly play to the grain of our view we might be at the bottom of the business cycle around now. Call it ‘peak bad’. Our GDP forecasts continue to pencil in a slow return to economic growth from the final quarter of this year.
That may be so but, as ever, there are a couple of cautions to fold into the mix.
First, the hole that we are emerging from may end up being deeper than previously thought. We’re forecasting a cumulative GDP decline of 0.6% over the second and third quarters of this year. Various bottom-up and top-down indicators of short-term economic growth point to some residual downside risk on this view (Q2 GDP data released 19 September).
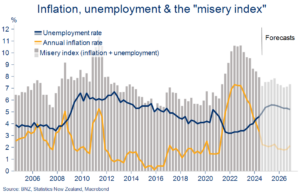
Second, the trudge up and out of the economic hole will feel like a slog for many. For one thing, the labour market will still be deteriorating – we’re still forecasting the unemployment rate to rise from 4.6% currently to 5.5% by March 2025. It then stays around there for the rest of next year.
So, while inflation worries may continue to retreat, the baton seems to be passing on to job insecurity. This can be seen, for example, in the unfortunately titled “misery index.” It’s an indicator of how households are experiencing the economy produced by adding the unemployment rate and annual inflation rate together.
As the chart shows, the expected lift in unemployment stalls what might have otherwise been further falls in the index. Thankfully, it’s a lot lower than it was but, on our forecasts, looks set to remain at a more elevated level than the 2015-2019 period.
Pulling all of the threads together doesn’t change our expectation that the Reserve Bank (RBNZ) will keep trimming the Official Cash Rate in 25bps lumps in coming meetings.
A quickening in the pace of cuts at the next (9 October) announcement appears unlikely given the economic picture is no worse than the RBNZ’s August forecasts. A larger, 50bp cut in the final (November) meeting of the year is more of an open question, and something financial markets continue to fully price.
But the important thing – for the RBNZ and for most people – is that market interest rates are still falling. The pace of declines has slowed as expected, but the downtrend continues and looks to have further to run. Falling global interest rates, with the US Federal Reserve near certain to kick off its own easing cycle this month, may further fan the flames.
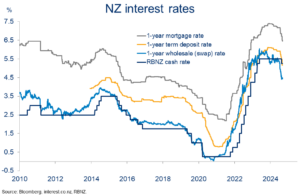
The OCR has only been lowered 25bps so far but retail rates have fallen much further given what’s been baked into expectations. One-year term deposit rates are now about 100bps below the peaks. Falls in 2-5 year fixed mortgage rates have been of a similar or larger magnitude while rates on shorter terms having fallen by a little less.
In our recent Property Pulse we laid out our view for mortgage rates and what this might mean for the housing market. In short, our OCR forecasts are consistent with a 2-year mortgage rate close to 5% by the middle of next year (from just under 6% now). That is expected, with all the usual caveats around house price forecasting, to help drive a modest 7% lift in house prices over 2025, following a flat performance over the rest of this year.
But the question has been asked: what might all of that mean for housing affordability? After all, falling mortgage rates and potentially higher house prices work in opposing directions in an affordability sense.
The short answer is that all cases will be different. But for a general macro sense of the net effect we can run a few scenarios through our affordability index.
The index tracks the three core components of the housing affordability equation: the size of the required deposit, the cash required to service a mortgage, and the household incomes used to pay these bills. It estimates the average cost of a house deposit and first year of mortgage bills, all expressed as a multiple of the average household disposable income.[1]
The latest iteration shows:
- A big improvement is in train for the current (September) quarter, thanks to falling mortgage rates alongside continued income growth and flat-to-falling house prices.
[1] In practice, we assume a deposit of 20% of the median national house price. To this we add debt servicing costs in the first year (i.e. interest only), based on an 80% LVR and a 50/50 mix of floating and 2-year fixed mortgage rates, all expressed as a multiple of the average household disposable income. Technically, the discounted value of future debt servicing costs should be included, but we’ve simplified for ease of interpretation.
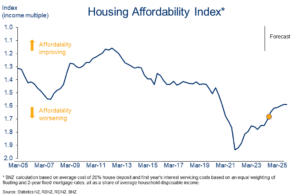
- This continues the modest recovery in housing affordability since the trough in late 2021 when house prices peaked. Our index is up about 15% over that time.
- Our (lower) mortgage rate and (higher) house price forecasts for next year largely cancel each other out in the workings of the index. Based on our forecasts for the inputs, the index is projected to improve very slightly from Q4 through to the end of 2025.
- Despite this, in an absolute sense, housing affordability is expected to remain stretched. Our index is set to remain in a worse state compared to where it was prior to the pandemic in early 2020.
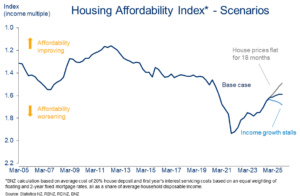
- The scenario chart below illustrates that, under a scenario in which house prices flat-line for the next 18 months (and all other assumptions are held constant), the housing affordability index would get back to 2020 levels late in 2025. If instead, income growth flatlines, the index would wind up around 6% worse than our base case by the end of 2025.
To subscribe to Mike’s updates click here
Disclaimer: This publication has been produced by Bank of New Zealand (BNZ). This publication accurately reflects the personal views of the author about the subject matters discussed, and is based upon sources reasonably believed to be reliable and accurate. The views of the author do not necessarily reflect the views of BNZ. No part of the compensation of the author was, is, or will be, directly or indirectly, related to any specific recommendations or views expressed. The information in this publication is solely for information purposes and is not intended to be financial advice. If you need help, please contact BNZ or your financial adviser. Any statements as to past performance do not represent future performance, and no statements as to future matters are guaranteed to be accurate or reliable. To the maximum extent permissible by law, neither BNZ nor any person involved in this publication accepts any liability for any loss or damage whatsoever which may directly or indirectly result from any, opinion, information, representation or omission, whether negligent or otherwise, contained in this publication.