Holdin’ On
28 Nov 2024
- The housing market is slowly thawing, and falling mortgage rates will keep the recovery warm
- We maintain our long-held forecast for a 7% lift in house prices next year
- Relative population and supply dynamics net to an easing of demand pressure, moderating the expected upswing
- Short-term mortgage rates biased to fall further
Welcome to our final Property Pulse for 2024. Supporting our more regular Eco Pulse updates, the aim here is to chat through recent housing and mortgage rate happenings, and provide our take on the outlook.
Included in report:
The view, in brief
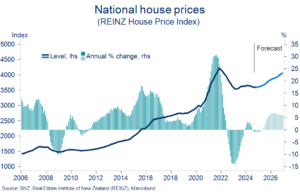
We’ve held the same 2025 house price view for some time. After a flattish 2024, we see the cycle turning into the new year, delivering around a 7% lift in house prices over 2025.
Recent developments have given us no reason to change this view. Housing activity is slowly stirring, and the consensus has shifted closer to our view. Still, kicking the tyres on our forecast, as we do below, leaves us with a smidge of downside risk. There’s also a fair amount of fog shrouding the 2025 macro-outlook in general.
The mortgage rate outlook has become more nuanced given the big falls to date and the degree of RBNZ easing already baked in. We see further falls in short-term mortgage rates. But longer-term rates appear to have less downside.
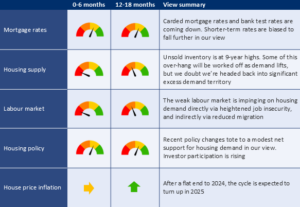
Impact of macro drivers on our house price view
The table below summarises the various drivers of house price inflation and their directional impact on our view.
Kicking the tyres
We’ve held the same 2025 house price view for some time. After a flat 2024 we see the cycle turning into the new year, delivering a lift in house prices of around 7% over calendar 2025.
Recent developments have given us no reason to change this view. But it’s still prudent to kick the tyres, as we do below. If anything, we’re left with a bit of downside risk to our central forecast.
Breaking it down
Stripped back, our house price view rests on two broad macro crosswinds:
- an expectation that falling interest rates unshackle the interest rate sensitive parts of the economy – housing chief amongst them – delivering a modest upturn in economic growth and house price inflation through 2025.
- Relative population and supply dynamics net to an easing of demand pressure, moderating the extent of any house price lift.
Shading the impact of these factors are our views on the labour market and housing policy.
1. Lower interest rates get into their work
On the first point, falling interest rates do seem to be getting into their work of helping to slowly unfreeze some of the economy.
The clearest example has been in soaring business confidence. But we’re also seeing slivers of light emerge in some of the ‘harder’ data. Retail card spending is still subdued but has at least stopped falling. The prior downtrend in building consent issuance has been arrested, and housing market activity continues to slowly stutter back to life. It’s slow going, but it’s going.
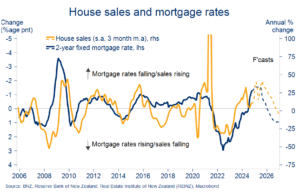
Monthly house sales, at 6150 (s.a.) in October, are still running below the roughly 6700 long-run average. The numbers are even more underwhelming when expressed on a per-capita basis, arguably the more relevant metric given the population/construction booms of recent years.
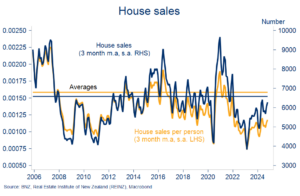
But a recovering trend is nevertheless clear. Sales over the three months to October are up 7% on the prior three months and are now 40% above the 2022 lows (all seasonally adjusted).
Turnover in some parts – like Canterbury and Otago – is already back to or above average. At the same time, some of the softer indicators like auction clearance rates, open home attendance, and mortgage applications are increasingly tilting upwards.
A good chunk of this extra activity reflects investors being lured back out of hibernation by falling interest rates. There’s the cash flow relief, but also the extra borrowing capacity afforded by lower bank test rates. According to the Reserve Bank, these have declined to about 8% as at October, from 9% in mid-2024.
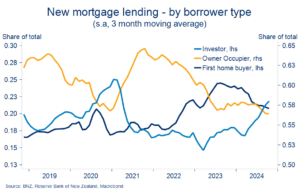
Further falls in short-term mortgage rates, coupled with the more investor-friendly shift in tax policies – the final leg of which being the full restoration of interest deductibility in April 2025 – suggests the trend towards higher investor participation is likely to continue. That would help fan a broader lift in housing demand through early 2025. When mortgage rates fall, housing activity lifts (chart below).
This is not to say there will be an immediate impact on house prices. For now, any extra demand pressure continues to be readily absorbed by all of the supply coming onto the market.
New listings in September and October were strong, even allowing for the usual spring flush. Unsold inventory has consequently nudged higher since our last update and is now at 9-year highs, equivalent to 5½ months’ worth of sales.
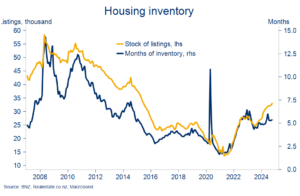
There is little pressure on prices to rise in this environment of ample choice and time for buyers. Indeed, the flat-to-falling trend in national house prices remains intact. The October REINZ House Price Index slipped 0.5% on our seasonally adjusted estimates. That puts it 1.8% below where it started the year and only 1.3% ahead of the April 2023 low in the house price cycle. Big picture, house prices have been going sideways for 18 months.
We expect this inventory overhang to be slowly worked off as housing activity floats back to more normal levels over the coming 6-12 months. As the market shifts out of the current oversupplied position, house prices are likely to start rising again.
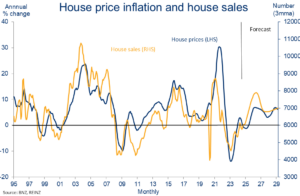
It’s nevertheless prudent to acknowledge the uncertainty surrounding our mortgage rate, and hence housing, expectations over the second half of 2025. Indeed, the Reserve Bank yesterday appeared to carve out a little more policy flexibility for next year. We still see further OCR cuts ahead but have flagged a touch of upside risk on our projections for a 2.75% bottom of the Official Cash Rate cycle.
2. Relative population and supply dynamics net to an easing of demand pressure
There’s been plenty of discussion about the extra pressure on housing resources arising from the recent burst of migration-driven population growth. Particularly set against the coincident downturn in home building activity.
Evidence of this extra pressure can be seen in some of the data, most obviously the period from mid-2023 to mid-2024.
Over 50% of new migrants settle in Auckland (see our recent note). And there was a noticeable bump in Auckland house prices relative to the NZ median from mid-2023 as population growth soared. A clear acceleration in nation-wide rental inflation occurred around the same time.
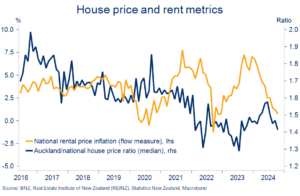
Both metrics have since turned lower again as the migration boom has wound down from a near 135k annual pace to sub-50k (as at September). New tenancy rental inflation has dropped back to almost zero and Auckland and national house prices resumed small monthly declines from May.
The point is that the extra demand-impulse clearly had an impact, but one that appears to be now passing. The pressure on the national housing stock did not appear to worsen by as much as some of the commentary suggested it could have.
Indicative of such – the number of people per dwelling rose over 2023 but looks to have already peaked at about 2.6 people. Our forecasts are consistent with downward pressure from here.
We expect population growth to cool further as the still-weakening labour market holds migration down around the current 20-30k (annualised) pace. At the same time, the residential building cycle looks close to bottoming out, and expectations of a turn higher early next year are solidifying. Building consent issuance is stabilising and surveyed construction intentions have jumped.
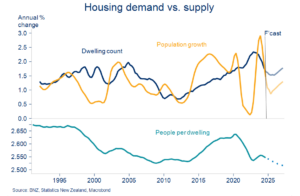
There are a lot of moving parts in all of this but in our view the net points to an easing of net demand pressures from here. That would imply less upward pressure on house prices as the mortgage and economic cycle turns.
Another way to think about it is the flipside of the situation in early 2020. Back then, the country looked well short of houses as we went into lockdown. That created tinder-box conditions for house price appreciation once mortgage rates were slashed. Current conditions are a little different.
Mortgage rate outlook
Our view at a glance*

Floating rates – more to go
The Reserve Bank (RBNZ) lopped another 0.5% off the Official Cash Rate yesterday (OCR). The decision was not only widely expected by the economentariat, it was also fully factored into market interest rate pricing.
For this reason, there wasn’t a lot in the decision likely to immediately shift fixed mortgage rates. By contrast, floating rates are adjusting lower. They’re likely to end the year 100-120bps lower than the 8.60% peak.
We didn’t see anything in the RBNZ’s words and actions to warrant a change to our existing interest rate view. As a central case, we continue to expect 25bps cash rate cuts at every RBNZ meeting from here until a low of 2.75% is reached by October 2025. There’s a decent change of another 50bp cut in February, but the pace and extent of further cuts will depend on how the economy evolves.
It’s also worth flagging that the outlook at longer-term horizons is foggier than it was. The inflation risks associated with Trump 2.0 and more protectionist trade practises introduce some upside risk on our projection for the cash rate to go sub-3% in late 2025.
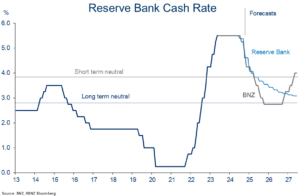
The upshot for floating mortgage rates is that a drop into the ‘6s’ through the first part of next year still looks a strong chance. But the deeper falls into the low 6s and beyond implied by our OCR forecasts now have more uncertainty attached to them.
Fixed rates – more downside for shorter terms
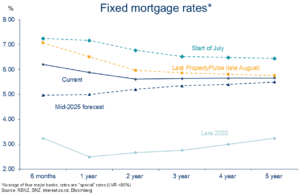
Six month to two-year fixed mortgage rates have fallen 105-130 basis points since the Reserve Bank signalled in July that interest rates were about to come down.
Falls in longer-term (3-5 year) fixed rates have been smaller (80-90bps, chart below). That is, the mortgage rate curve is slowly normalising – or becoming less ‘inverted’ – as short-term rates fall relatively faster. We flagged this in our last edition but think the trend has further to run.
Adjustments in mortgage rates continue to closely follow those in wholesale markets (swap rates). However, the decline in wholesale rates hit pause, or even reversed a little through October and November. This mostly reflects the jag back up in global interest rates.
It begs the question as to whether the downtrend in mortgage rates might soon run out of steam as well. The downforce has probably dissipated reflecting:
- The front-loaded easing cycle. Mortgage rates have to date fallen faster than the OCR as expectations of future OCR cuts have been baked in. This means there is less room for mortgage rates to fall in future as those OCR cuts are gradually delivered upon.
- Trump 2.0 inflation risks. The prevailing narrative is that the US President-Elect’s policy platform is inflationary. It’s also wildly uncertain and potentially negative for global growth computations. But it does further muddy the waters on how far the OCR might fall over second half of next year.
Incorporating these factors still leaves us with a view that short-term mortgage rates have further to fall from here. Just how far they fall is more of an open question, but ‘picking the bottom’ was going to be a tall order anyway. Our assumption is that one and two-year rates fall into the low 5s by the middle of next year with significantly less downside for longer-terms. The chart below provides a sense of the direction.
Mortgage strategy
Before diving into the rate fixing debate, it’s worth reiterating that getting a mortgage strategy “right” is primarily about meeting a borrower’s financial needs and requirements for certainty. Trying to pick the timing of interest rate movements is fraught with difficulty.
The fixing decision is nonetheless becoming more pertinent given the mortgage book is so short. Reserve Bank data shows 83% of all new mortgage lending over the past two months has been for terms of 1-year or less. That’s contributed to a further shortening in the average term of the stock of borrowing. 51% of all mortgage debt will experience a mortgage rate reset over the coming six months. That is the highest share since at least 2016 when the RBNZ’s data coverage begins.
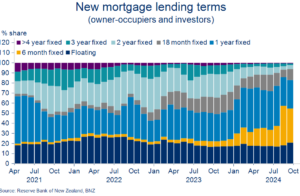
Though it has cost more upfront, this strategy of ‘going short’ has so far paid off given the falls in mortgage rates to date.
But what now? The upfront cost of refixing for a short-term has reduced given the flatter mortgage curve, but so have the potential benefits given there’s probably less mortgage rate downside than there was.
Breakeven analysis can help put some structure around these relativities. Consider the example of someone looking to fix for either one year or two years. It’s possible to fix for two years now at around 5.6%. An alternative is paying a slightly higher rate around 5.9% to fix for one year, and then hoping that the one-year rate is lower when you come to refix in a years’ time.
To breakeven on the rolling shorter-term strategy, the one-year rate needs to fall to at least 5.4% by the time you come to refix in 12 months’ time. Our interest rate view suggests there is a reasonable chance of this scenario being achieved. All else being equal, that indicates there may still be value in fixing for shorter terms like the one year.
We caution though that going all-in on an entirely short-term strategy entails accepting more interest rate risk. And that is in an environment of rising uncertainty generally. In addition, very long-term mortgage rates like the 5-year rate may not have a whole lot further to fall. Some borrowers may thus prefer to hedge their bets by spreading some of their risk out into the longer terms.
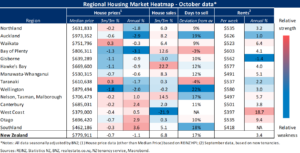
Appendix: Regional Heatmap
Our housing market heatmap provides a snapshot of the relative strength of housing markets around the country. Overall, it’s (relatively) warmer in the south, cooler in the north.
To subscribe to Mike’s updates click here
Disclaimer: This publication has been produced by Bank of New Zealand (BNZ). This publication accurately reflects the personal views of the author about the subject matters discussed, and is based upon sources reasonably believed to be reliable and accurate. The views of the author do not necessarily reflect the views of BNZ. No part of the compensation of the author was, is, or will be, directly or indirectly, related to any specific recommendations or views expressed. The information in this publication is solely for information purposes and is not intended to be financial advice. If you need help, please contact BNZ or your financial adviser. Any statements as to past performance do not represent future performance, and no statements as to future matters are guaranteed to be accurate or reliable. To the maximum extent permissible by law, neither BNZ nor any person involved in this publication accepts any liability for any loss or damage whatsoever which may directly or indirectly result from any, opinion, information, representation or omission, whether negligent or otherwise, contained in this publication.


