Is the economy responding to interest rate cuts?
12 Dec 2024- We tour the economy’s four most interest rate-sensitive sectors for signs of a rate cut response
- Impact to date more one of stabilisation than elevation
- Perhaps unsurprising given the lags involved. The bulk of interest rate relief will come through next year
- The impacts on confidence and the exchange rate have been a little more immediate, and support our forecasts for a reasonable economic recovery in 2025
There is a general expectation that cuts in interest rates will eventually pull the economy out of recession. The Official Cash Rate (OCR) has been slashed 125bps since August. It’s early days, but folk are starting to ask if we’re seeing a response.
Below, we check in on some of the economy’s more interest rate-sensitive sectors. At a high level, the reaction to rate cuts, to date, appears consistent with an economy shifting out of reverse and into neutral.
Conditions are still weak in the here and now. But forward motion beckons for early 2025 though as OCR cuts work their way into lower paid interest rates and recent confidence and exchange rate impacts grease the wheels. The precise timing and extent of the recovery remain as uncertain as ever.
How far have interest rates fallen?
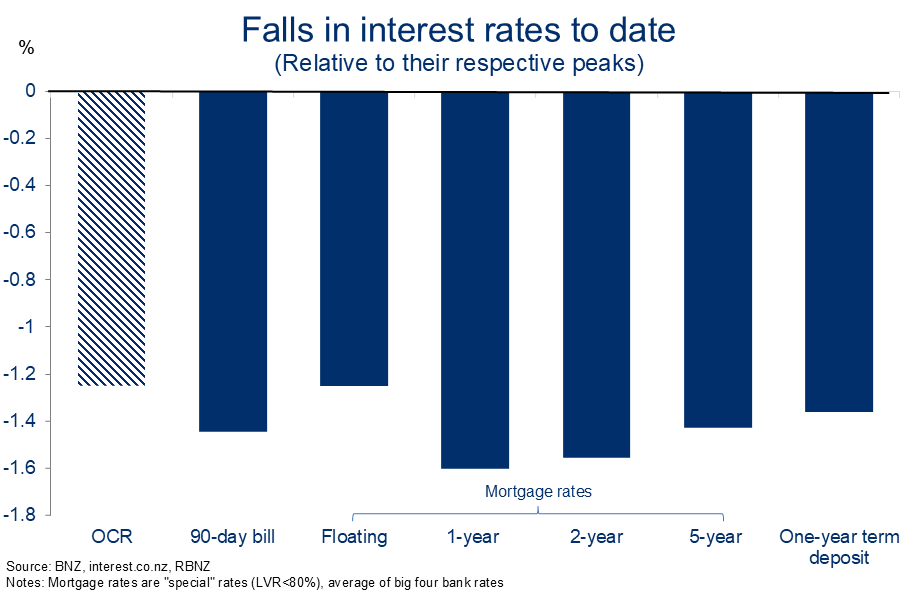
The first point to note is that the Reserve Bank’s OCR cuts have had a material impact on market interest rates. Indeed, mortgage rates and the 12-month term deposit rate have so far fallen further than the OCR. The same goes for the 90-day bank bill rate, a common reference rate for business lending.
In part, this reflects wholesale markets anticipating further OCR cuts next year. Markets see a low in the cash rate of around 3.1% by late 2025, not far from our own (2.75%) expectation.
The drops in interest rates to date are great news for new borrowers. For example, a prospective home buyer looking to purchase a median house (approx. $780k) with a 20% deposit is now looking at an annual interest bill about $9k below where the calculations were landing at the start of the year.[1]
[1] We assume the 80% debt requirement is split equally across floating and 2-year fixed mortgage rates.
However, household and business appetite to take on additional borrowing has been understandably subdued given the poor economic backdrop and labour market.
What about rates that are paid on existing borrowing? These tend to move more slowly given the preponderance of fixed-rate borrowing in NZ. Reserve Bank data shows, as at October, there had been about a 50bps drop in the average interest rate paid by business borrowers from the 2023 peak.
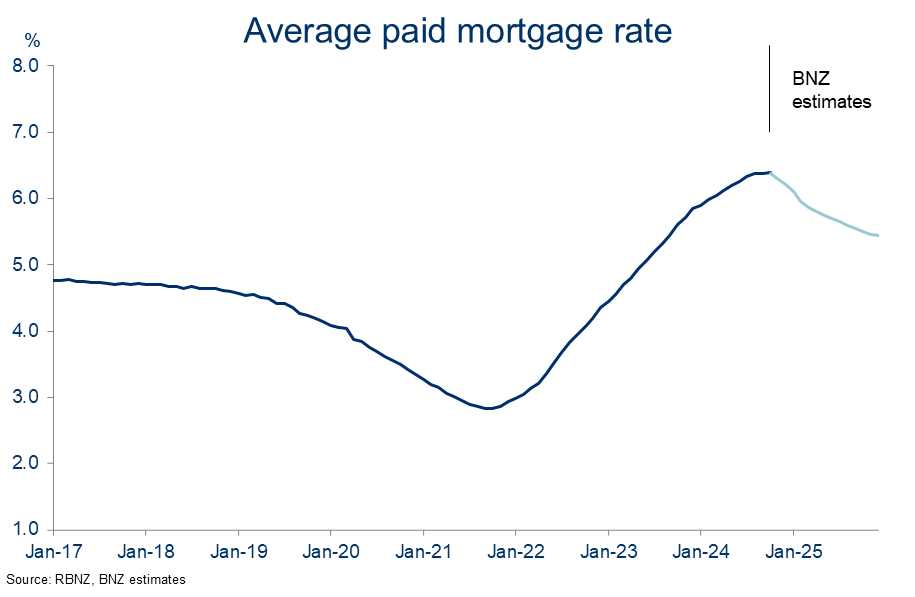
As we’ve been flagging though, the average interest rate paid on existing mortgage borrowing is yet to fall. It even lifted marginally to 6.39% in October. Holding this rate up has been an increasing number of mortgage borrowers opting to roll onto (higher than fixed) floating rates, in anticipation of additional declines and lower interest payments ahead.
The good news is that, over the coming six months, a record 51% of all mortgage borrowings will experience a rate reset onto likely lower rates. Thus, by mid-2025, we estimate the average paid mortgage rate will have dropped to around 5.7%, with further declines likely over the second half of next year (chart above).
Signs of life?
So, the bulk of the inbound interest rate relief on the stock of debt will be felt next year. This is important context as we fish around for signs of an economic response to OCR cuts.
In terms of where to look, we follow the breadcrumbs laid out from some recent Reserve Bank analysis. The Bank estimates that the four production sectors of the economy displaying the highest sensitivity to interest rates are: construction (7% of GDP), manufacturing (9% of GDP), retail trade (5%), and arts & recreation (3%).
Construction: Still in decline but ‘soft’ indicators brighten
Next week’s third quarter GDP figures will very likely show residential construction activity falling for the seventh quarter of the past eight. Moreover, we reckon we’ll get at least one more negative after that. If so, this would put the level of residential building activity around 15% below the 2021 peak.
The 2021-22 explosion in build costs, lower house prices, and high interest rates have all played a part in this.
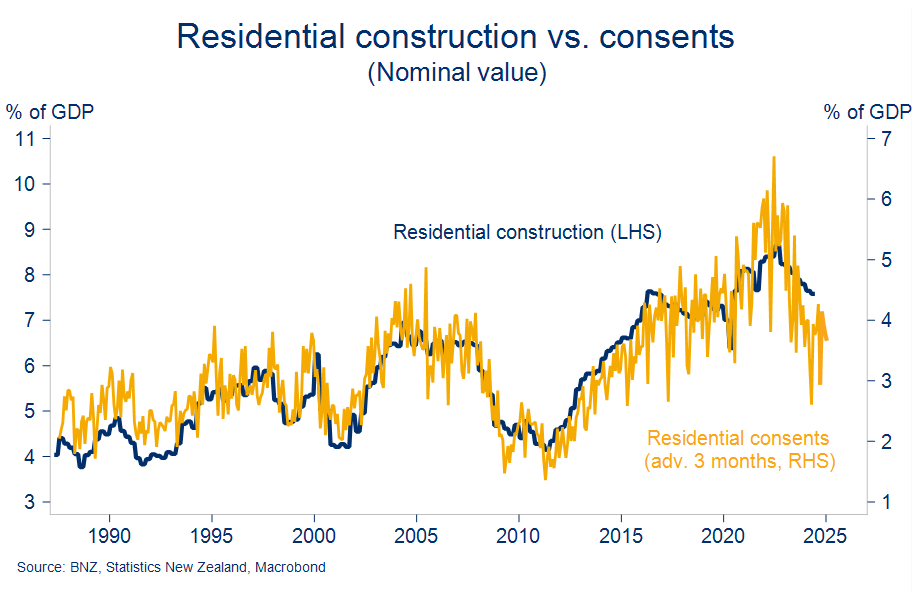
Encouragingly, the anecdote and forward indicators appear to have turned in a more positive direction. Hard data it isn’t, but the apparent stabilisation does accord with our forecasts for a gradual turning in the construction cycle over the first half of 2025.
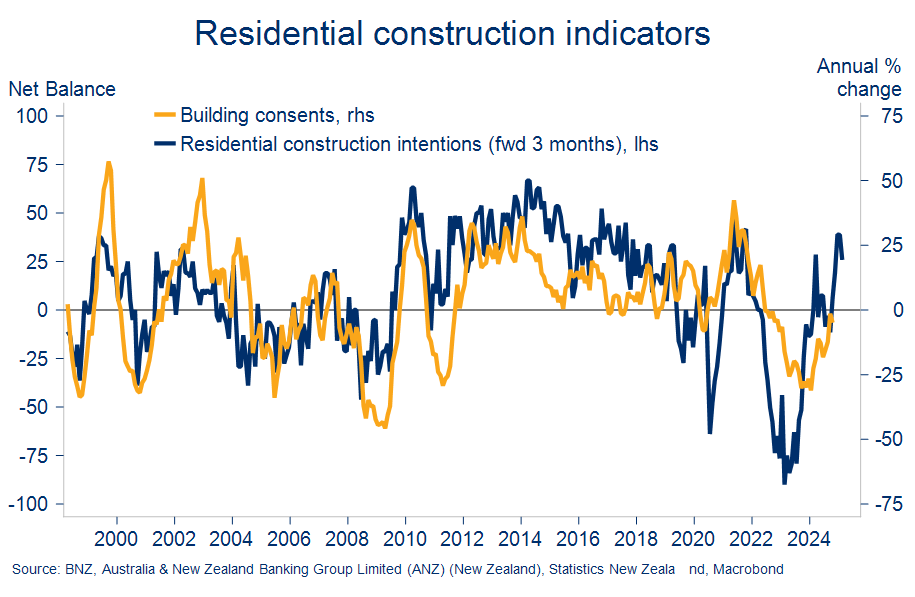
The prior decline in building consent issuance flattened out late in 2023 around the time interest rates stopped rising. There have been signs of lift more recently, particularly for stand-alone house consents, and in the Otago, Canterbury, and Waikato regions (see our construction chartpack for more).
With interest rates now falling, surveyed residential building intentions have rocketed to above average levels. Historically, these intentions provide a good lead on future consenting activity, suggesting the budding recovery in the latter can be sustained.
However, building costs have yet to fall to any material degree and this might limit the number of projects that actually see the light of day. That is, the big gap in the cost of buying an existing home vs. building new remains a constraint on building activity. We expect some of this gap to be eroded next year if house prices start to rise.
Retail: Still subdued, but past peak pain
It’s news to no one that retail spending has been hammered during the recession. The 10% contraction in sales volumes over the past 2½ years is the largest we’ve seen in the data going back to the mid-90s.
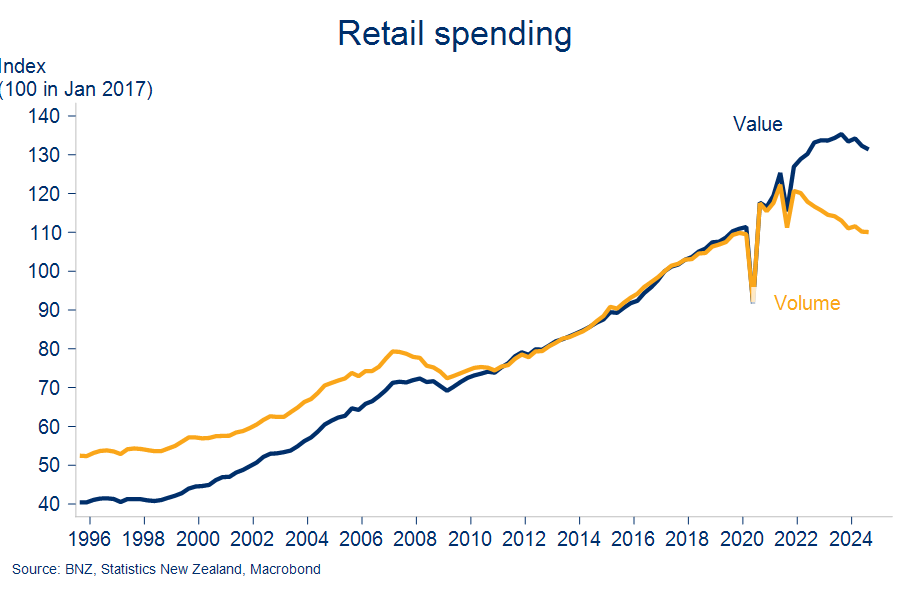
But we may be past the point of peak pain in that regard. Since the OCR was first lowered in August, we’ve had three consecutive increases in monthly retail card spending figures. While the timing lines up with the interest rate cycle, an easing in cost-of-living pressures (food and petrol prices particularly) is probably at least as influential in steadying spending activity. July’s modest tax cut will have also helped.
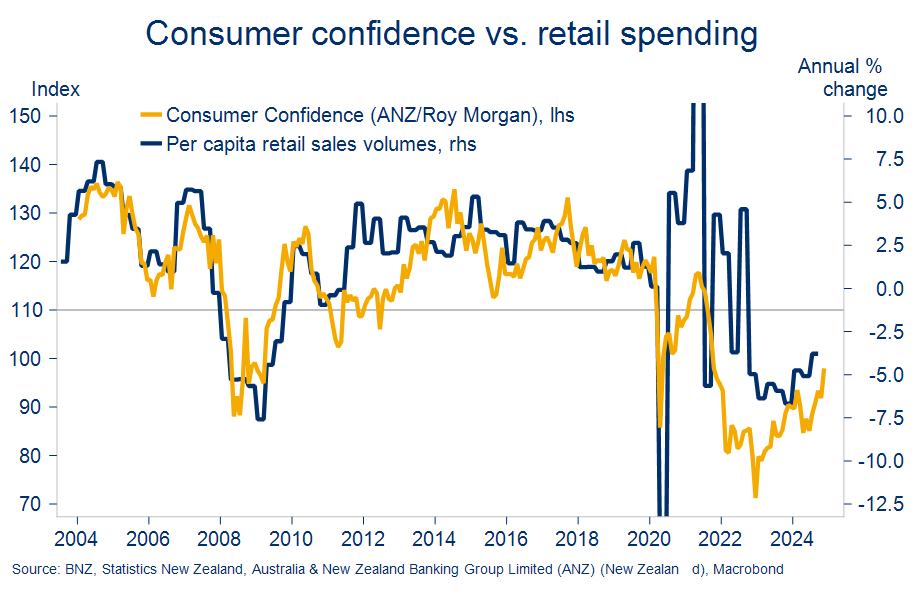
Spending patterns in BNZ’s own card data suggest that much of the recent growth is being accounted for by things like government charges, utilities, and service bills. So headlines about households loosening the purse strings again need to be treated with caution. Particularly given the labour market continues to deteriorate and people tend to spend less when they feel less secure in their jobs.
Nonetheless, consumer confidence, while still low, has convincingly turned a corner. Further falls in mortgage rates and a much-improved outlook for cash flow in parts of the rural sector also bode well for the tentative recovery we expect to build through next year.
Manufacturing: still struggling
NZ’s manufacturing sector continues to face into stiff headwinds. Not only has it been caught in the global manufacturing downdraft of the past two years, but it is highly leveraged to residential construction and household spending – two sectors at the forefront of NZ’s recent economic woes.
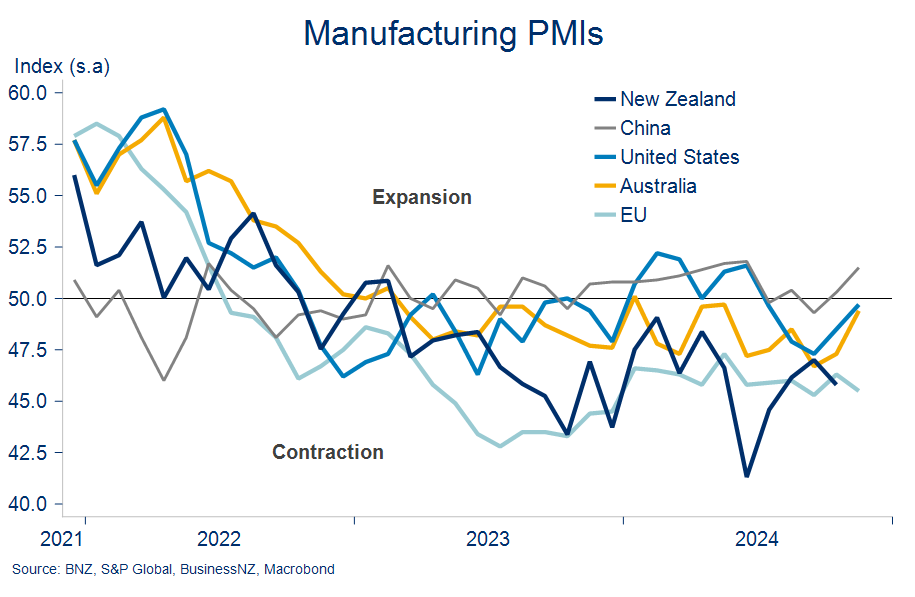
The Performance of Manufacturing (PMI) index has been anchored south of the 50.0 ‘breakeven’ level for 20 consecutive months now. The pace of contraction has at least reduced from the very troubling readings of June/July as interest rates have come down. But, at 45.8 in October, the level of the index is indicative of a sector still a long way from expansion.
Our economic forecasts have manufacturing GDP slowly improving from around now as the broader economic cycle turns. But we concede that, if anything, the risk is that the manufacturing recovery proves slower to get started.
Arts & recreation: unsure
This component of GDP can loosely be thought of as the fun stuff. A dearth of indicators means we are flying a tad blind as to how the sector is progressing. But to provide an indication we’ve put together our own ‘fun index’. It’s based on BNZ card spending in those store-types that most closely match what Stats NZ says goes into Arts & Recreation services.
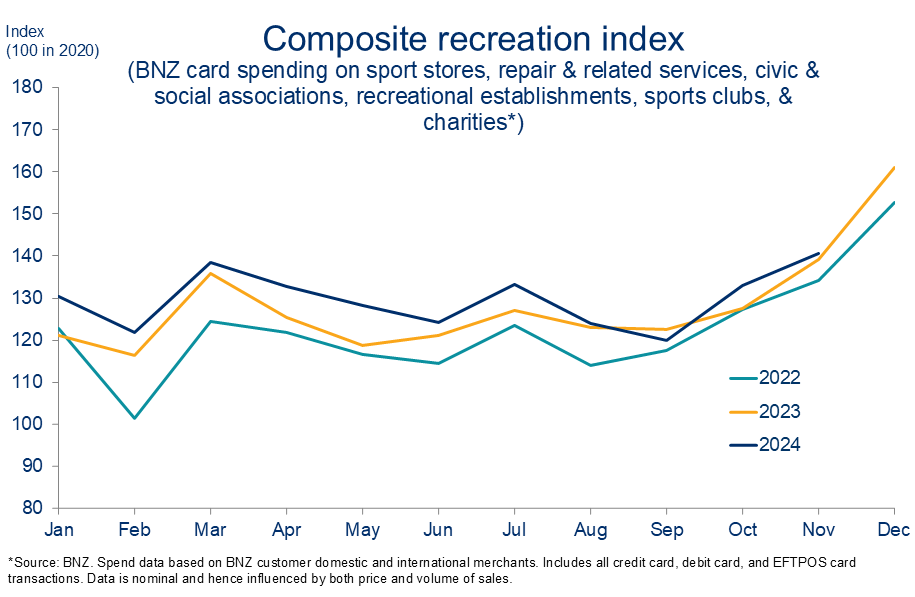
Broadly speaking, spending on recreational activities appears to be tracking around the same as last year. Which, means, once you account for inflation, the number of fun activities being consumed – at least on our narrow measure – is likely well down year-on-year. Here’s hoping 2025 turns out better.
Not the only game in town
Pulling the sectoral threads together, it’s clear that the economic response to rate cuts to date has been small and reasonably tentative. That’s not hugely surprising given the OCR is still at restrictive levels overall and it takes a while for cuts to work their way into the interest rates that people pay and receive.
But it’s important to note that lower interest payments are not the only way less restrictive monetary policy works. Cutting the cash rate and saying there’s more to come can also lower the exchange rate, boost asset prices, and lift confidence. These impacts tend to be more immediate and we’re seeing elements of all of them in play.
Most of the recent NZ dollar’s recent decline is linked to the strength of the US dollar post the return of Donald Trump. But the NZD has still underperformed all G10 currencies over the five months since the RBNZ first flagged cash rate cuts were on the cards in July. If the lower NZD/USD is sustained, and our forecasts suggest it will be, it will provide an extra leg-up for export returns that are already starting to look healthy in some sectors (e.g. dairy and horticulture).
Evidence of a boost for asset prices, and any associated ‘wealth effect’, is mixed. The NZ share market is rising but there is a strong offshore updraft to this. Local house prices are not rising but our view is that lower interest rates: a) likely prevented a deeper correction this year, and b) will help drive an upturn in house prices next year.
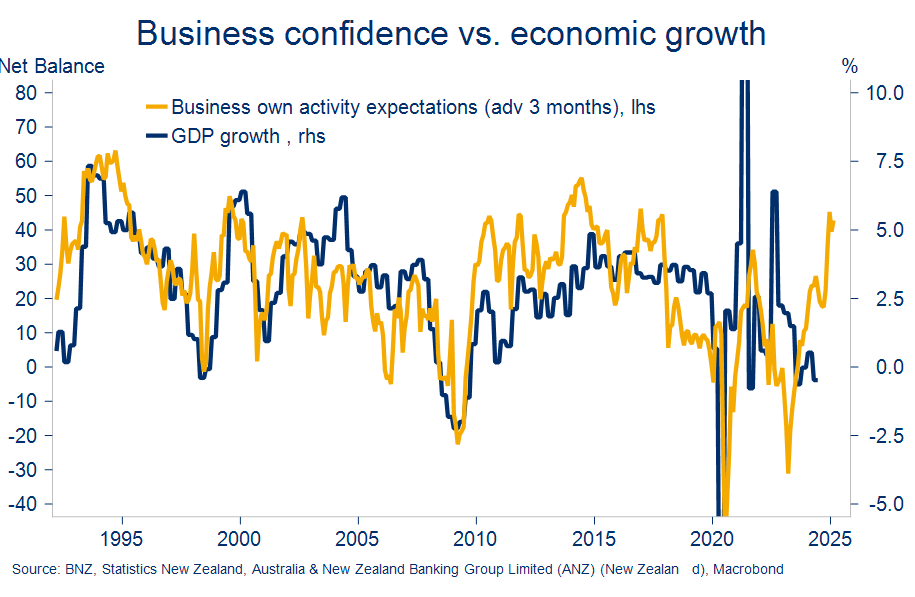
Finally, confidence has most definitely perked up. Both consumer and business sentiment have been in the ascendancy since early 2023 but an expectation of lower interest rates has supercharged particularly business confidence recently. Firms’ expectations of their own output are at the highest level since 2014.
Historically there’s a strong directional (but far from perfect) link between firms’ expectations of their own business activity and what gets delivered. So, while a more confident populace does not mean the recovery is assured, it does provide a rung of support to our forecasts for economic growth to pick-up to around 3% next year.
To subscribe to Mike’s updates click here
Disclaimer: This publication has been produced by Bank of New Zealand (BNZ). This publication accurately reflects the personal views of the author about the subject matters discussed, and is based upon sources reasonably believed to be reliable and accurate. The views of the author do not necessarily reflect the views of BNZ. No part of the compensation of the author was, is, or will be, directly or indirectly, related to any specific recommendations or views expressed. The information in this publication is solely for information purposes and is not intended to be financial advice. If you need help, please contact BNZ or your financial adviser. Any statements as to past performance do not represent future performance, and no statements as to future matters are guaranteed to be accurate or reliable. To the maximum extent permissible by law, neither BNZ nor any person involved in this publication accepts any liability for any loss or damage whatsoever which may directly or indirectly result from any, opinion, information, representation or omission, whether negligent or otherwise, contained in this publication.


