Housing balance tilts towards supply
27 Feb 2025
- Population growth undershooting that of dwelling stock
- Partly explains rising rental, real estate listings
- Divergence between average house purchase costs and rental equivalent narrows, but still above average
- Housing demand stirring, but starting position of ample supply will blunt house price implications
Lost in last week’s Reserve Bank excitement was the confirmation from Stats NZ that the boom in population growth has well and truly deflated.
In the final quarter of last year, the country gained just 11,400 people. This meant that, in little over a year, annual growth in the population sputtered from 3% highs not seen in 77 years, to just 0.9% for calendar 2024.
A rapid cooling in net migration delivered all of this slowing. The pace of annual net inflows fell to around 30k in the fourth quarter, 100k fewer than a year prior. By contrast, natural population growth (births less deaths) maintained the slow and steady recovery it’s been on since the lows of early 2023.
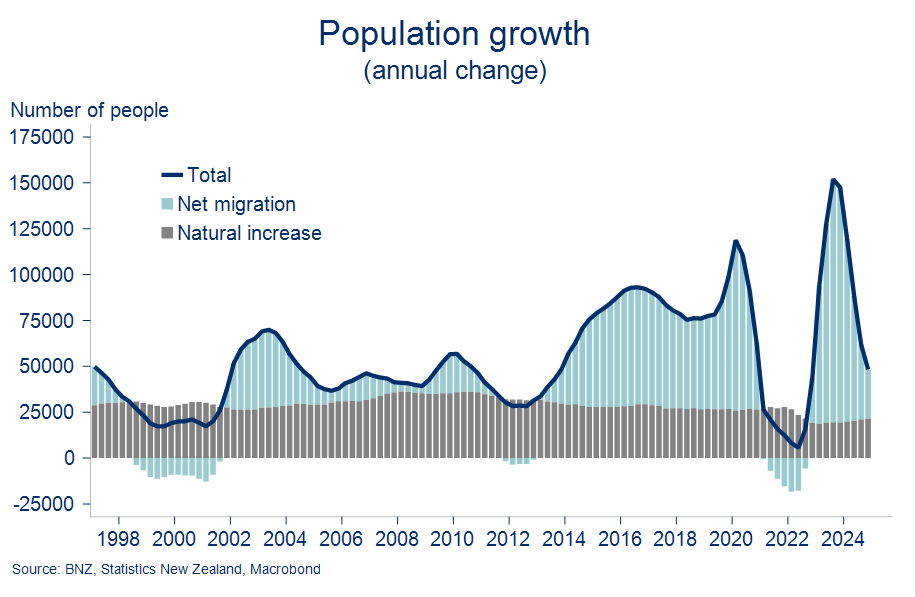
We’ve made the point before, but the population growth prop being kicked out from under the economy in mid-2024 undoubtedly contributed to the rapid deterioration in growth later confirmed for the second and third quarters.
Over the past few months, we’ve seen net migration stabilise at annualised rates around 25-35k. That’s consistent with the rough run-rate we’ve been forecasting for this year. It leaves us with a view of positive, but below average expansion in the population over the next 18 months or so. It adds to the list of factors likely to check the pace of recovery this year.
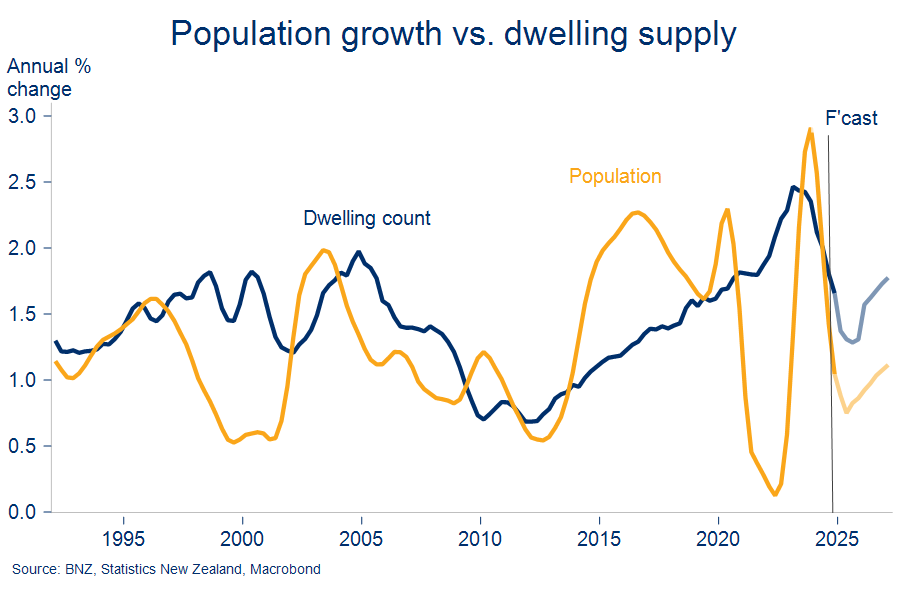
There are likely to be implications for housing as well. Below, we set population growth against growth in the stock of dwellings. Forecasts for both should be handled with care. But the point is that growth in the population looks set to track below that of the housing stock for at least this year. Whatever your view of the current housing demand/supply (im)balance, it points to a reduction in pressure from here.
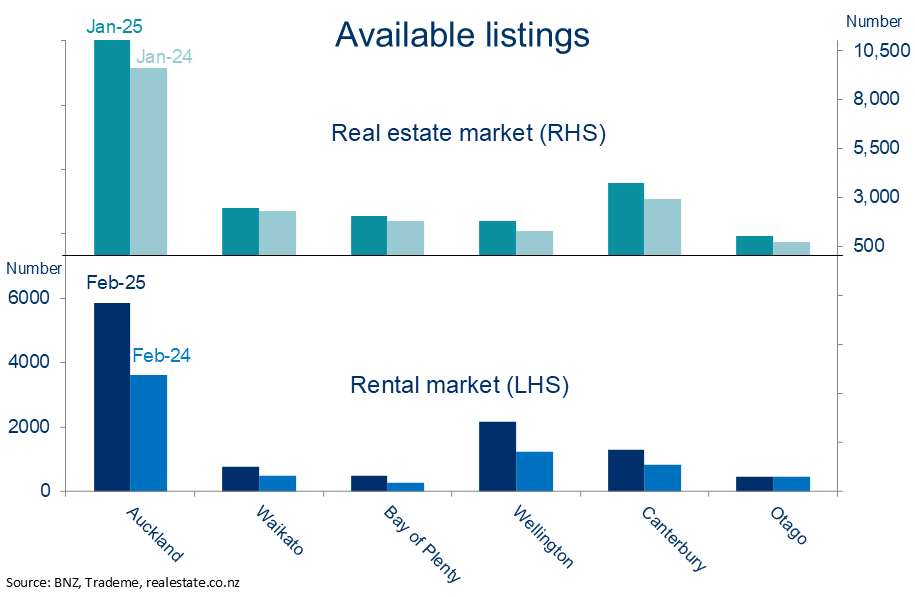
Against this backdrop, listings in both the rental and real estate markets continue to float upwards. On our count, available rental listings on Trademe, at roughly 12,400, are running 60% above levels prevailing this time last year.
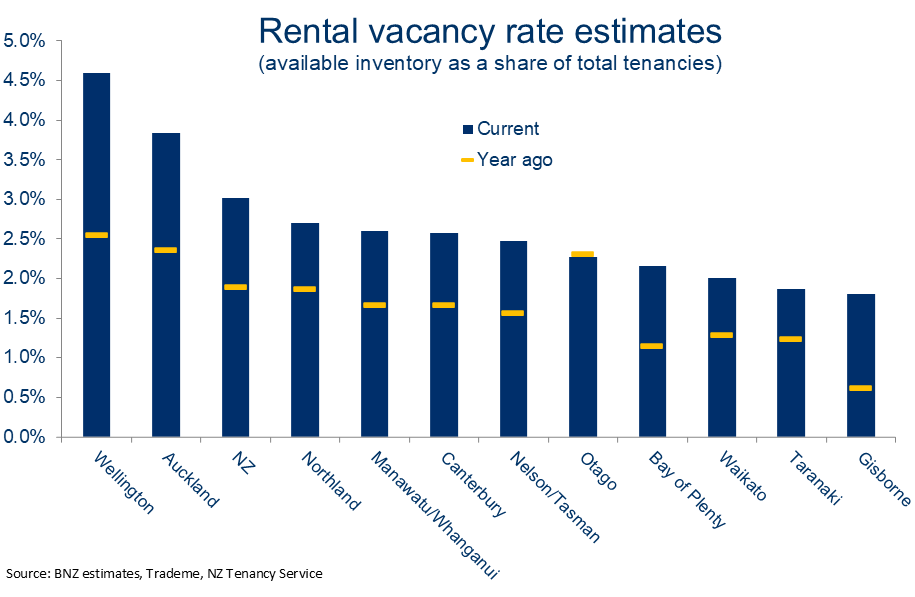
Yes, the overall rental market is now larger than it was, but this picture of excess supply holds even after adjusting for this. Rental vacancy rates – available listings as a share of total tenancies – have also lifted strongly in all regions (ex-Otago) and particularly so in Wellington and Auckland.
Excess supply remains a feature of the real estate market too, albeit to a lesser extent. Unsold housing inventory remains around 10-year highs, and 20% above year-ago levels. The largest annual increases – as at January – were in Otago and Wellington.
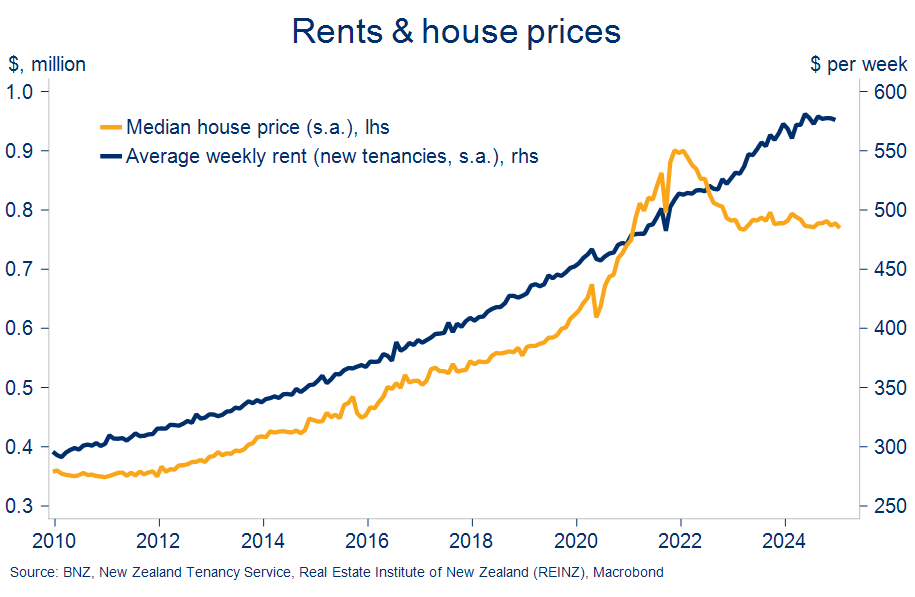
These shifts in the relative housing market balance have had the expected suppressing impact on price gains.
Having climbed about 10% from late 2022 to the start of 2024, rental prices for new tenancies have since broadly flat-lined.
Meanwhile, over in the housing market, the gentle uptrend in available inventory has helped entrench the now two year-long sideways trend in national house prices.
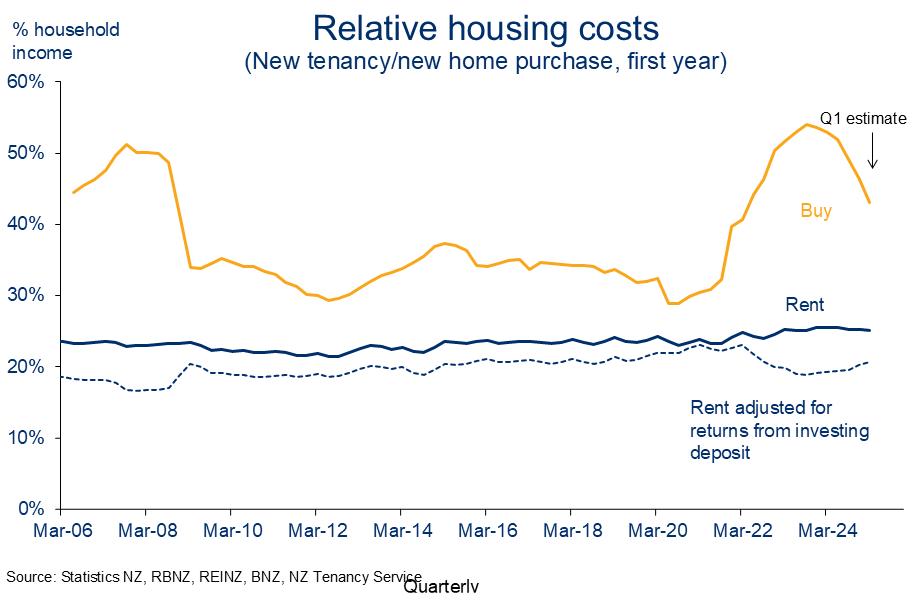
Properly assessing the relative costs of entering the rental and real estate market brings interest rates and other home ownership costs into the equation.
Producing an apples-with-apples comparison can be tricky, but we return to the simplified framework we’ve used before. It proxies the observable (i.e. first year), operational costs of:
- Purchasing a median house, financed with a 20% deposit and the remaining 80% as (interest only) debt. Interest costs are split equally across floating and 2-year fixed mortgage rates. We also add in an estimate of average maintenance, rates, and insurance costs;
- Entering into a new rental tenancy at the NZ median rent ($575 per week). To make it a fair comparison,, we add in the (after-tax) returns from leaving the 20% deposit from (1) above in the bank earning interest.
The results are indicative and of course won’t reflect all situations. But from our approximations below we can see that there is still a noticeable divergence between the cost of servicing a new house purchase and the equivalent rental costs, but that the gap has narrowed significantly (to approximately 43% of household income to purchase vs. 25% to rent).
The decline in estimated average purchase costs reflects falls in mortgage rates alongside flat house prices, offset to some degree by higher cash outlays for rates, insurance and maintenance. Our estimates of these have increased to 1.8% of the median house price (or circa-$14k) – the highest in our limited estimate set.
This analysis is narrow in the sense it only covers first year operational costs – not two of the big unknowns like future inflation (which tends to boost rents but deflates borrowers’ debt costs over time) and of course what happens to house prices.
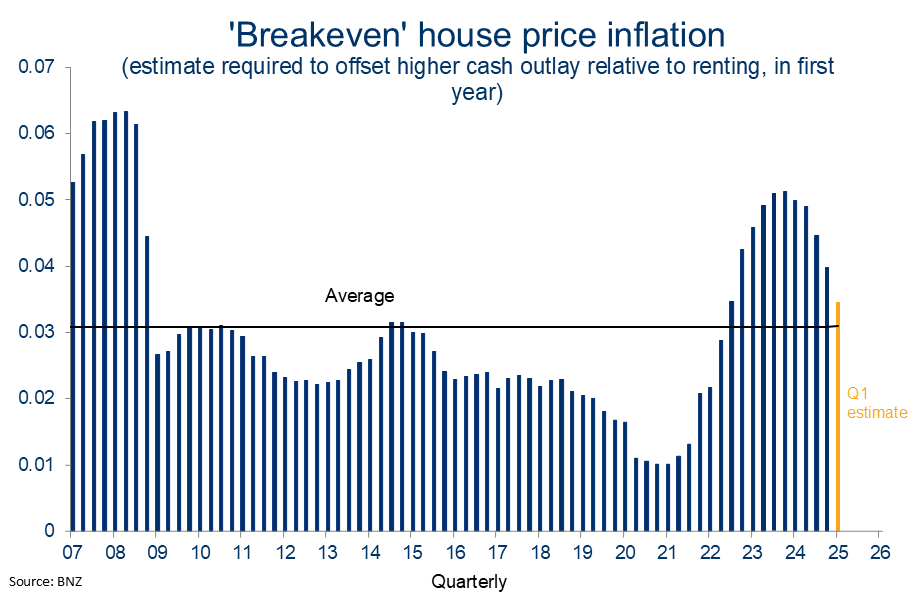
The latter generally ends up being the most important swing factor as it can swamp all else. For example, in the current environment, a 4% increase in house prices would (on paper) offset the relatively higher operational costs of purchasing a house relative to renting.
The chart opposite shows that this concept of “breakeven” house price inflation has come down but is still positive and notably above the long-run average. In short, the estimated costs of buying, on net, are less unappealing than they were, in an absolute sense and relative to renting.
It’s something we expect to drive a bit more demand in the housing market over the remainder of this year. Some of this is already detectable. New lending flows are picking up, sales activity is recovering, and some of the anecdote has perked up too.
But whether all this is enough to produce a notable lift in house prices will depend on how the expected extra demand measures up to the heightened supply noted earlier. Our expectation remains that we’ll see excess supply worn down producing a 5-7% bump in house prices through the year. But the supply side of the story is one of many areas of uncertainty surrounding our forecasts.
To subscribe to Mike’s updates click here
Disclaimer: This publication has been produced by Bank of New Zealand (BNZ). This publication accurately reflects the personal views of the author about the subject matters discussed, and is based upon sources reasonably believed to be reliable and accurate. The views of the author do not necessarily reflect the views of BNZ. No part of the compensation of the author was, is, or will be, directly or indirectly, related to any specific recommendations or views expressed. The information in this publication is solely for information purposes and is not intended to be financial advice. If you need help, please contact BNZ or your financial adviser. Any statements as to past performance do not represent future performance, and no statements as to future matters are guaranteed to be accurate or reliable. To the maximum extent permissible by law, neither BNZ nor any person involved in this publication accepts any liability for any loss or damage whatsoever which may directly or indirectly result from any, opinion, information, representation or omission, whether negligent or otherwise, contained in this publication.